For a long time, “scaling” in foundation models mostly meant one thing: spend more compute on pre-training and capabilities rise. That intuition was supported by empirical work such as Kaplan et al. (2020), which reported predictable power-law trends in loss as you scale model parameters, dataset size, and training compute. In practice, these trends justified sustained investment in large-scale accelerator capacity and the surrounding distributed infrastructure needed to keep it efficiently utilized. But the frontier has evolved—and scaling is no longer a single curve. NVIDIA’s “from one to three scaling laws” framing usefully emphasizes that, beyond pre-training, performance increasingly scales through post-training (e.g., supervised fine-tuning (SFT) and reinforcement learning (RL)-based methods) and through test-time compute (“long thinking,” search/verification, multi-sample strategies).
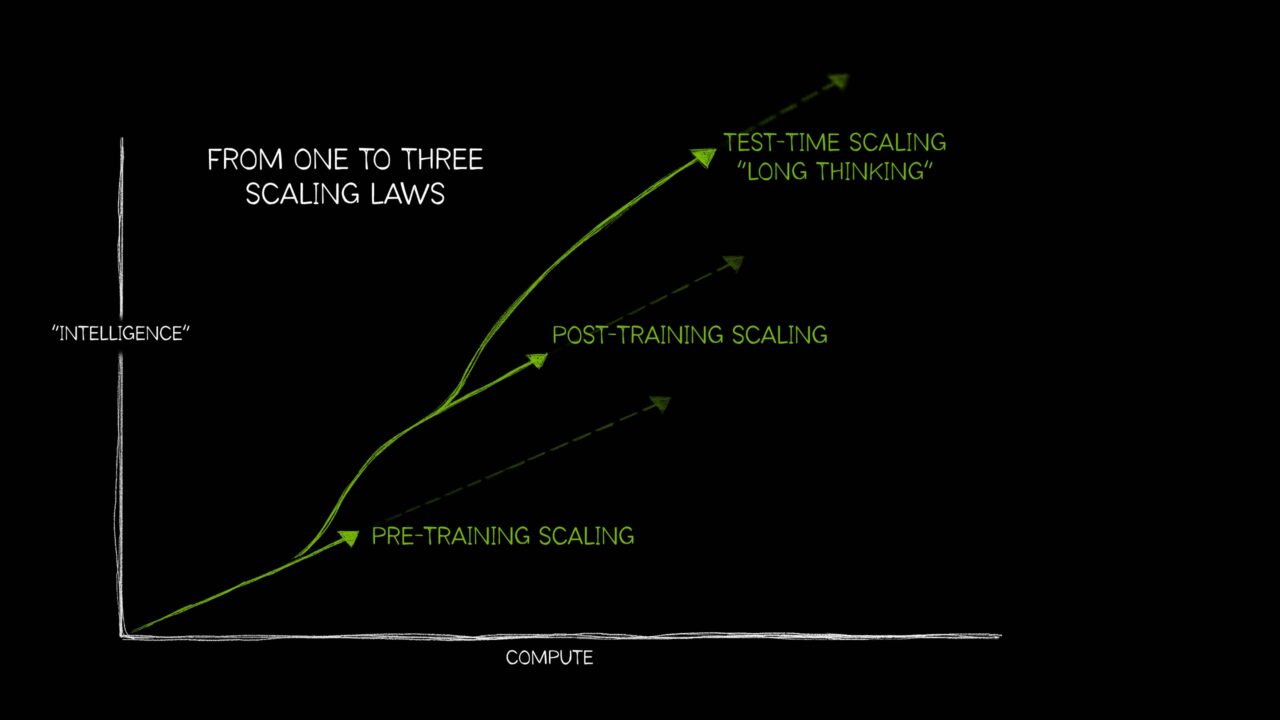
Figure: Adapted from “AI’s Three Scaling Laws, Explained” (NVIDIA Blog).
Taken together, these scaling regimes push the foundation-model lifecycle—pre-training, post-training, and inference—toward convergent infrastructure requirements: tightly coupled accelerator compute, a high-bandwidth low-latency network, and a distributed storage backend. They also raise the importance of orchestration for resource management, and of application- and hardware-level observability to maintain cluster health and diagnose performance pathologies at scale.
Another key trend is the increasing reliance of the foundation-model lifecycle on an open-source software (OSS) ecosystem that spans model development frameworks, cluster resource management, and operational tooling. At the cluster layer, resource management is typically provided by systems such as Slurm and Kubernetes. Model development and distributed training are commonly implemented in frameworks such as PyTorch and JAX. Monitoring and visualization—that is, observability—are often achieved using Prometheus for metrics collection and Grafana for visualization and alerting, positioned as an operational layer atop infrastructure and resource management. Figure 1 illustrates this layered architecture, showing how hardware infrastructure supports resource orchestration, which in turn enables ML frameworks, with observability spanning across all layers.
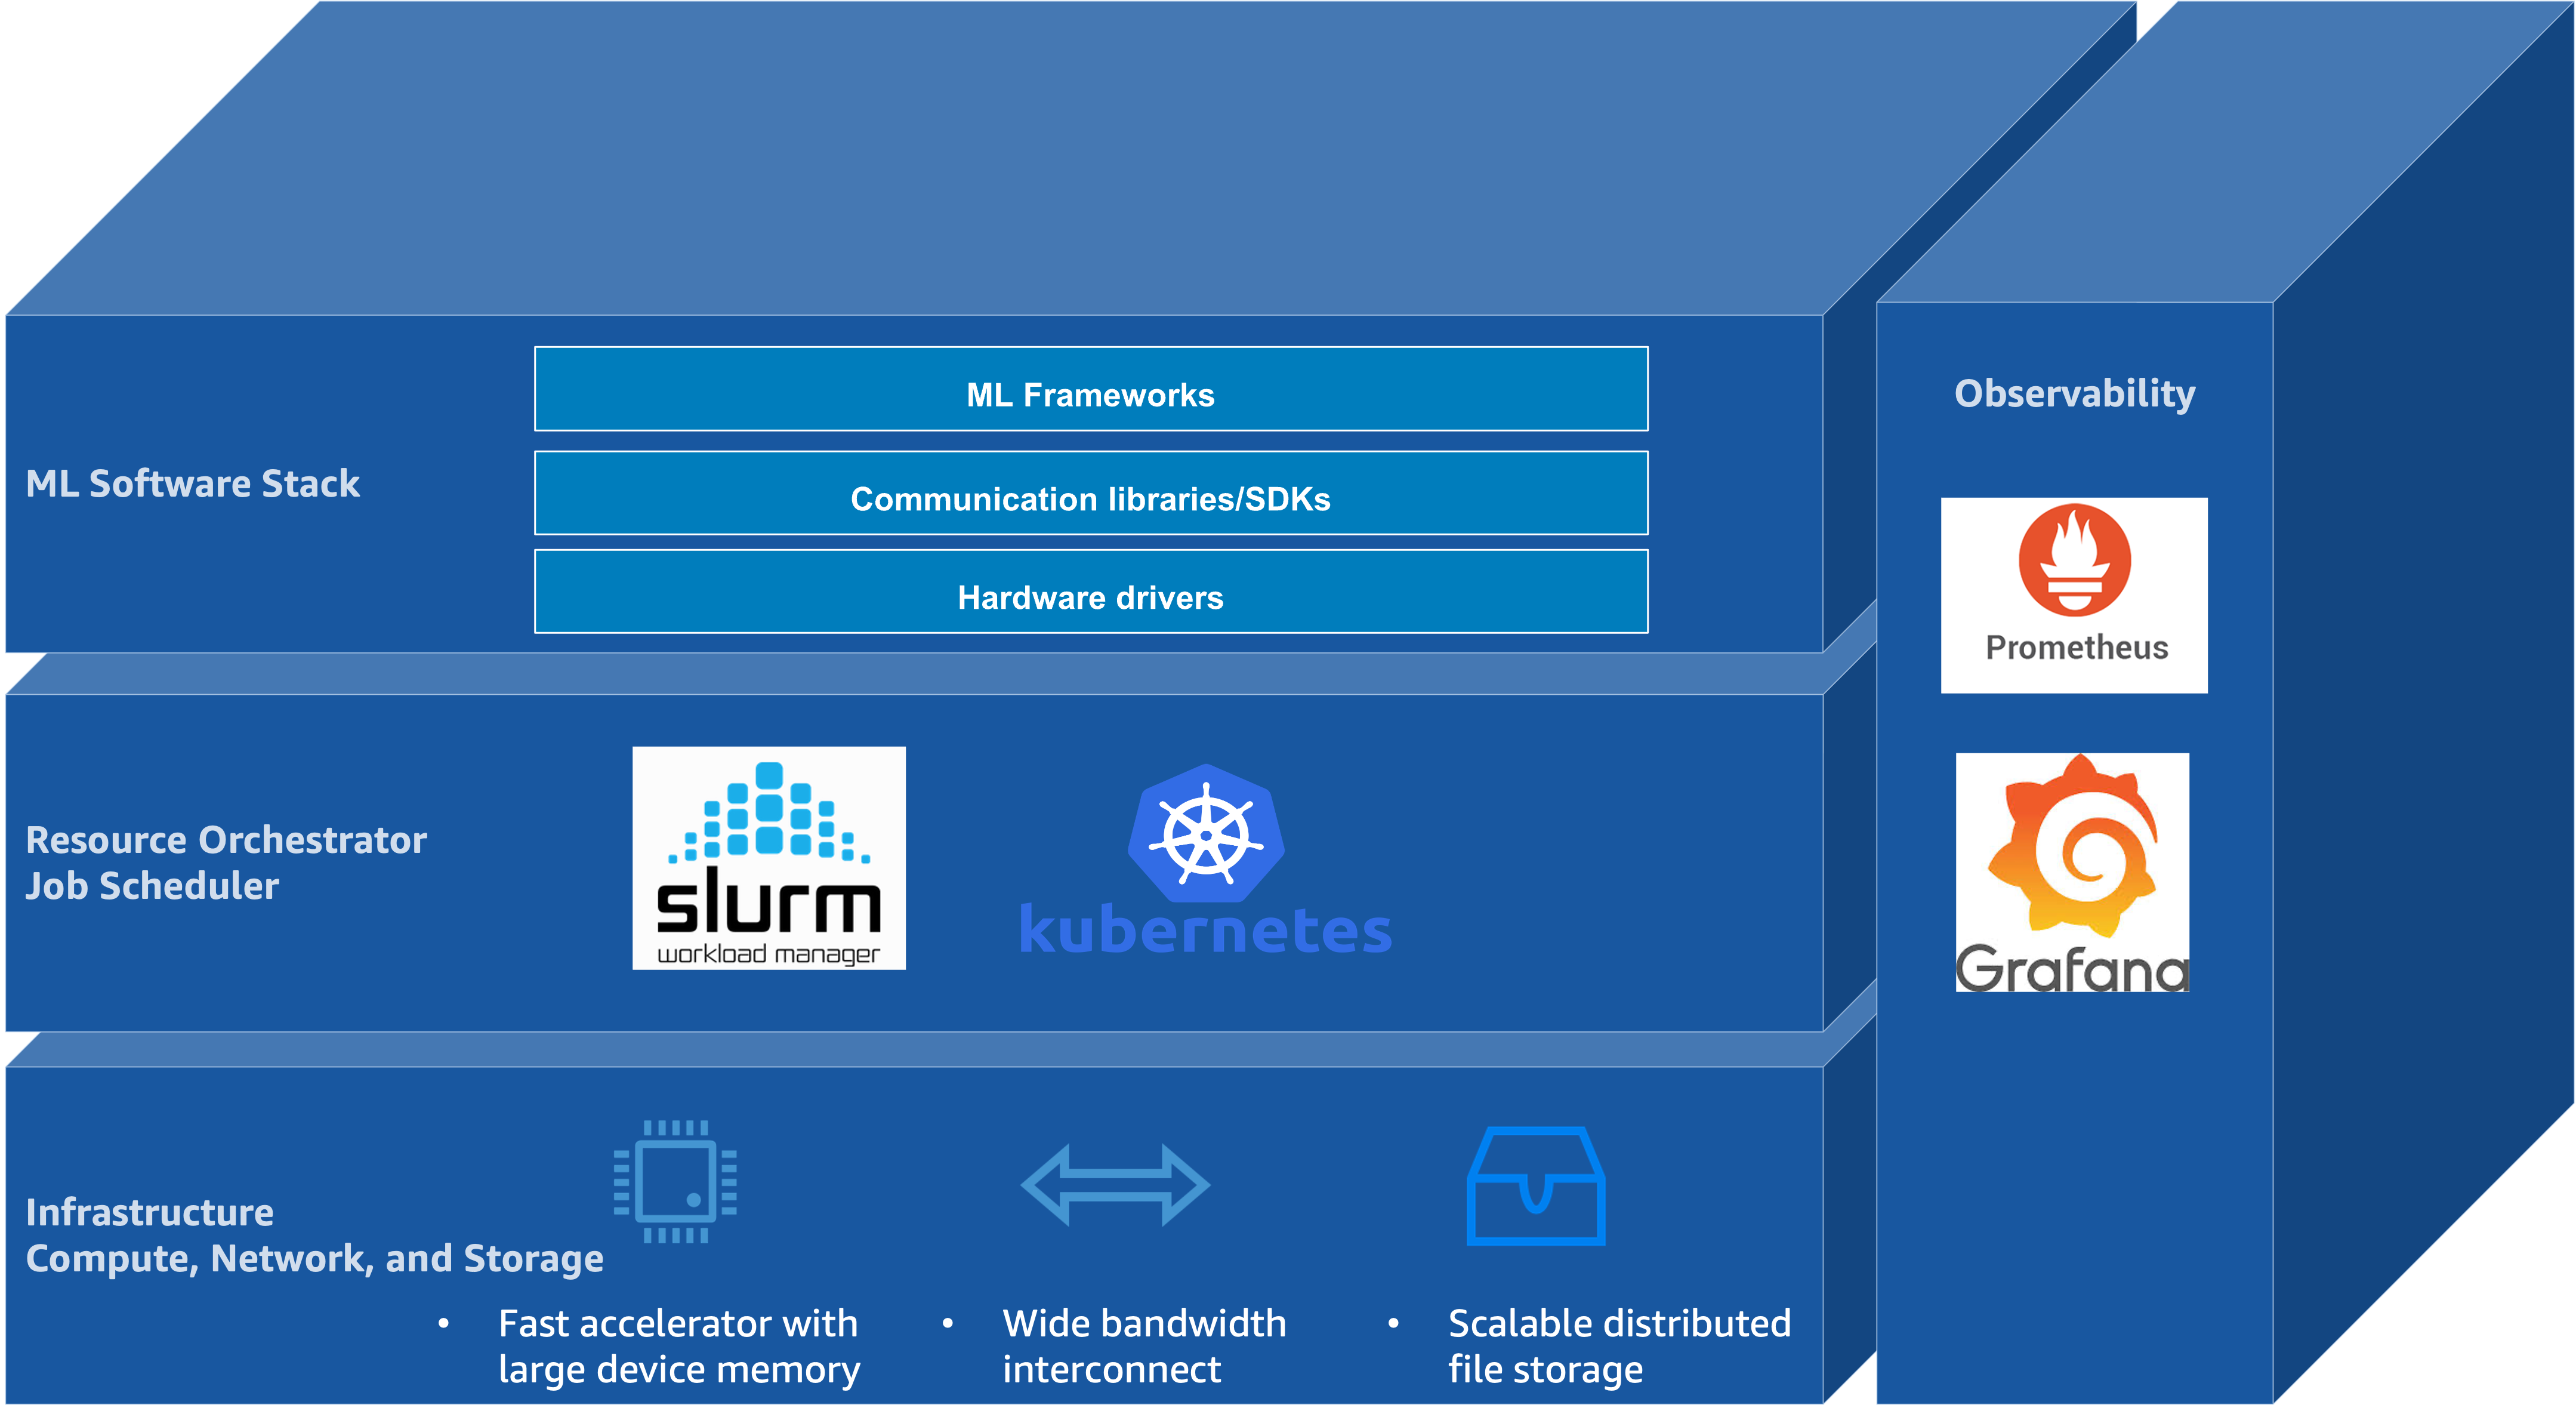 Figure 1: The layered architecture of open-source software stacks for foundation model training and inference
This post is intended for machine learning engineers and researchers involved in foundation model training and inference, with particular attention to workflows built atop OSS frameworks. It analyzes how AWS infrastructure—including multi-node accelerator compute, high-bandwidth low-latency networking, distributed shared storage, and associated managed services—interacts with common OSS stacks across the foundation model lifecycle. The primary goal is to provide a technical foundation for understanding systems bottlenecks and scaling characteristics spanning pre-training, post-training, and inference. This introductory post surfaces the overall system architecture, emphasizing the integration points between AWS infrastructure components and OSS tools that underpin large-scale distributed training and inference.
The AWS Building Blocks
The remainder of this series examines how this layered architecture is realized on AWS, progressing through infrastructure, resource orchestration, the ML software stack, and observability. The following sections preview each layer.
Infrastructure: Compute, Network, and Storage
As illustrated in Figure 1, infrastructure is anchored by three coupled building blocks—accelerated compute with large device memory, wide-bandwidth interconnect for collective communication, and scalable distributed storage for data and checkpoints.
Accelerated compute forms the foundation of large-scale foundation model pre-training, post-training, and inference. AWS offers several generations of NVIDIA GPUs as part of its Amazon EC2 accelerated computing instances, including the Amazon EC2 P instance family. The P5 instance family includes p5.48xlarge with eight NVIDIA H100 GPUs, p5.4xlarge with a single H100 GPU for smaller-scale workloads, and p5e.48xlarge/p5en.48xlarge variants with NVIDIA H200 GPUs. The P6 instance family introduces NVIDIA Blackwell B200 architecture with p6-b200.48xlarge and Blackwell Ultra B300 with p6-b300.48xlarge. Across these generations, the dominant scaling axes are peak Tensor throughput, HBM capacity and bandwidth, and interconnect bandwidth (within and across nodes).
As a first-order approximation, peak Tensor Core throughput—measured in floating point operations per second (FLOPS)—helps situate these accelerators on a common axis. The table below summarizes per-GPU peak throughput for dense BF16/FP16 and FP8 Tensor operations, along with HBM capacity and HBM bandwidth, using SXM/HGX-class specifications that align with NVSwitch/NVLink-based multi-GPU nodes.
| GPU (representative variant) | BF16/FP16 Tensor peak (dense) | FP8 Tensor peak (dense) | FP4 Tensor peak (dense) | HBM capacity | HBM bandwidth |
|---|---|---|---|---|---|
| H100 (SXM) | 0.9895 PFLOPS | 1.979 PFLOPS | — | 80 GB HBM3 | 3.35 TB/s |
| H200 (SXM) | 0.9895 PFLOPS | 1.979 PFLOPS | — | 141 GB HBM3e | 4.8 TB/s |
| B200 (HGX, per GPU) | 2.25 PFLOPS | 4.5 PFLOPS | 9 PFLOPS | 180 GB HBM3e | 8 TB/s |
| B300 (HGX, per GPU) | 2.25 PFLOPS | 4.5 PFLOPS | 13.5 PFLOPS | 288 GB HBM3e | 8 TB/s |
Note: NVIDIA product tables often report Tensor throughput “with sparsity”; this table reports dense throughput. Where applicable, dense throughput is taken as half of sparse throughput, following NVIDIA’s guidance for HGX-class platforms (NVIDIA). DGX figures are system-level; the B200 HBM capacity and bandwidth values are expressed per GPU by dividing DGX totals by eight (NVIDIA).
As models scale, step time is often dominated by collective communication and memory movement rather than raw compute throughput, motivating explicit scale-up and scale-out bandwidth accounting. For the multi-GPU instances, GPU communication spans two regimes. Internal scale-up (NVLink/NVSwitch) provides high-bandwidth, low-latency GPU-to-GPU connectivity within a node, enabling collectives such as all-reduce and all-gather to execute without traversing the host networking stack. External scale-out (EFA) provides OS-bypass networking across nodes, which AWS uses as a building block for Amazon EC2 UltraClusters where communication-heavy collectives span thousands of instances. The following table summarizes key specifications across these instance types:
| Instance Type | GPU | GPUs | GPU Memory | NVLink | NVLink BW (aggregate) | EFA | EFA BW (aggregate) |
|---|---|---|---|---|---|---|---|
| p5.4xlarge | H100 | 1 | 80 GB HBM3 | — | — | v2 | 12.5 GB/s |
| p5.48xlarge | H100 | 8 | 640 GB HBM3 | 4th | 7.2 TB/s | v2 | 400 GB/s |
| p5e.48xlarge | H200 | 8 | 1,128 GB HBM3e | 4th | 7.2 TB/s | v2 | 400 GB/s |
| p5en.48xlarge | H200 | 8 | 1,128 GB HBM3e | 4th | 7.2 TB/s | v3 | 400 GB/s |
| p6-b200.48xlarge | B200 | 8 | 1,440 GB HBM3e | 5th | 14.4 TB/s | v4 | 400 GB/s |
| p6-b300.48xlarge | B300 | 8 | 2,100 GB HBM3e | 5th | 14.4 TB/s | v4 | 800 GB/s |
Note: EFA bandwidth is converted from Gbps to GB/s (÷8) for consistency with other bandwidth metrics; see the EC2 accelerated computing networking specifications. NVLink and EFA bandwidth figures are shown as aggregate per-instance values rather than per-link values; see the P5 instance family page and the P6 instance family page for the corresponding intra-node interconnect and networking characteristics.
Elastic Fabric Adapter (EFA) is a network interface for Amazon EC2 that provides OS-bypass remote direct memory access (RDMA) capability using the Scalable Reliable Datagram (SRD) protocol. By enabling applications to communicate directly with the network device through the Libfabric API—bypassing the operating system kernel—EFA reduces latency and improves throughput for collective operations in distributed training.
Multiple generations of EFA are available on different instance families. Amazon EC2 P5 and P5e instances are equipped with EFA version 2 (EFAv2). EFA version 3 (EFAv3), provided on P5en instances, reduces packet latency by approximately 35% compared to EFAv2. EFA version 4 (EFAv4), available on P6 instances, delivers an additional 18% improvement in collective communication performance relative to EFAv3.
At scale, both distributed training (streaming corpora and writing multi-terabyte checkpoints) and large-scale inference (staging weights and managing KV cache growth) motivate a tiered storage hierarchy—local NVMe SSD for hot data, Lustre for shared high-throughput access, and Amazon S3 for durable persistence.
In this series’ primary multi-GPU instances, local NVMe is provided as instance store (ephemeral) with 30.72 TB raw capacity (8 × 3.84 TB NVMe SSD); see the EC2 accelerated-computing instance store specifications.
Lustre is an open-source, POSIX compliant distributed file system widely used in high-performance computing (HPC) to provide a shared namespace with high aggregate throughput across many clients. Amazon FSx for Lustre provides Lustre as a fully managed service and exposes it as a parallel file system capable of terabytes per second of throughput, millions of IOPS, and sub-millisecond latencies. Data Repository Associations enable integration with Amazon S3, supporting lazy loading of training datasets and automatic checkpoint export for durability.
At cluster scale, these instances are deployed in Amazon EC2 UltraClusters, which provision thousands of accelerated instances as a single, tightly placed cluster within an Availability Zone and interconnect them using a petabit-scale nonblocking network.
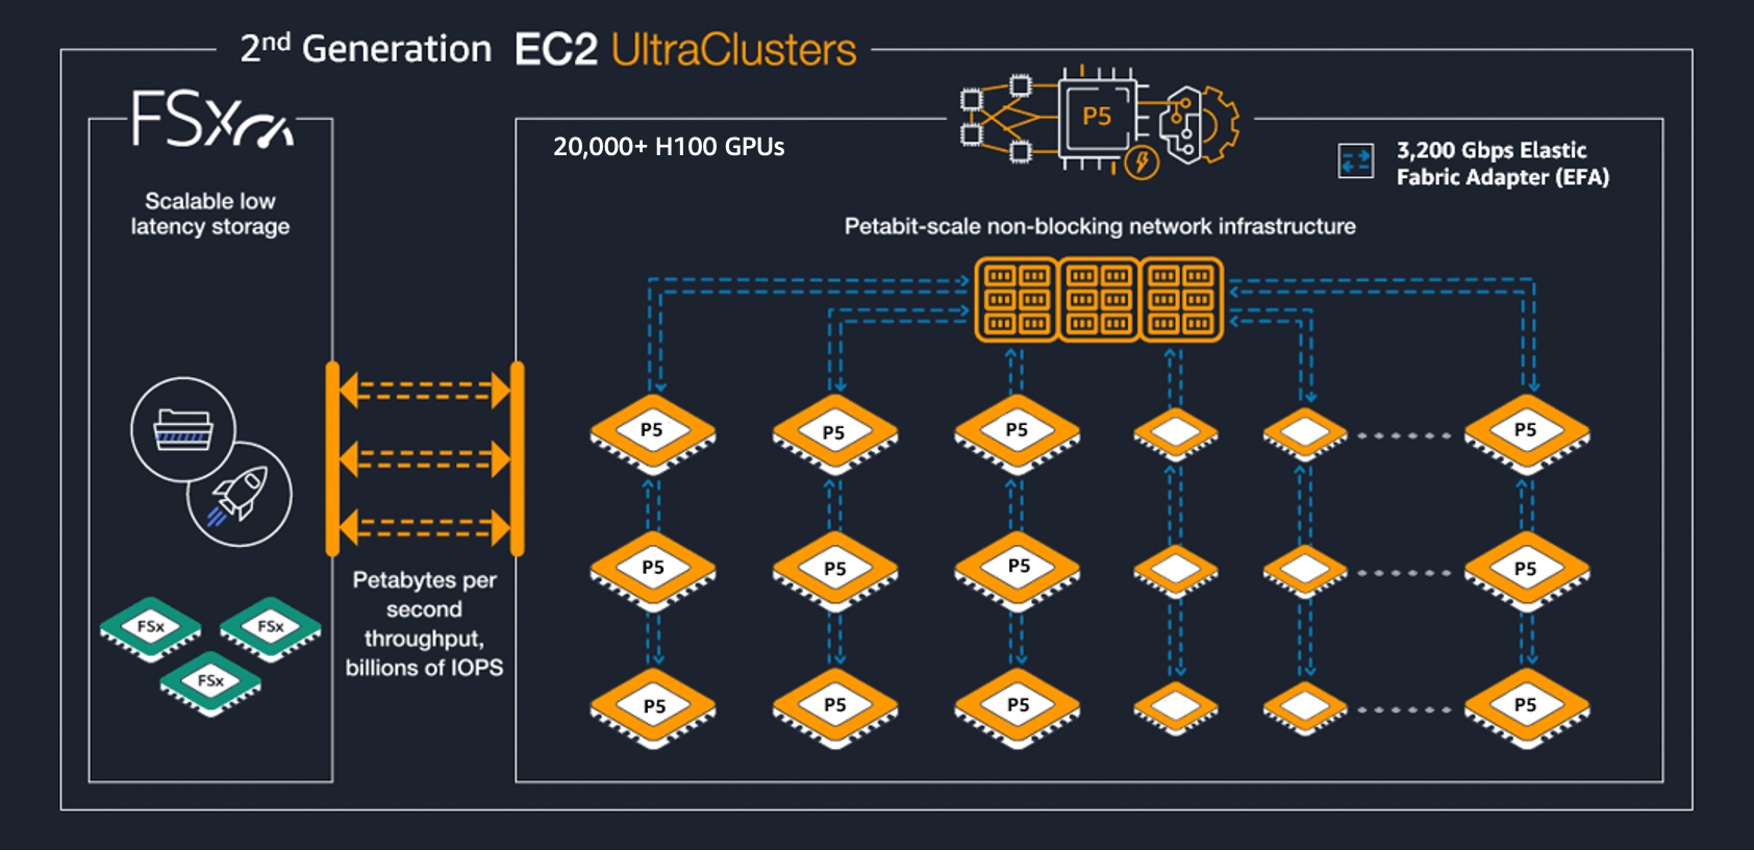
Figure: 2nd-generation Amazon EC2 UltraClusters (example P5 UltraCluster).
For workloads with high per-step communication intensity (e.g., expert parallelism in MoE models where all-to-all token dispatch spans many GPUs), the size of the NVLink domain can become a first-order constraint. As an extension of the internal scale-up axis, increasing the NVLink domain reduces how often performance-critical communication must leave the NVLink fabric.
Amazon EC2 UltraServers extend the NVLink domain beyond a single EC2 instance by connecting multiple component instances through a dedicated accelerator interconnect. AWS reports that P6e-GB200 UltraServers are built on the NVIDIA GB200 NVL72 platform and expose up to 72 Blackwell GPUs and 13.4 TB of aggregate HBM3e within one NVLink domain. At larger scales, EFA remains the cross-node fabric for multi-UltraServer jobs, but increasing the intra-domain GPU count can reduce how often performance-critical communication must leave the NVLink fabric.
These systems are built from NVIDIA Grace–Blackwell superchips, which couple Grace CPU memory and Blackwell GPU HBM via cache-coherent NVLink-C2C, enabling direct access across CPU- and GPU-attached memory without explicit host–device copies. In practice, this can extend the effective memory available to GPU workloads (e.g., by placing colder model state or KV cache in CPU-attached memory) while avoiding PCIe-scale copy overheads, albeit with higher latency and lower bandwidth than local HBM.
The component instance type for P6e-GB200 UltraServers is p6e-gb200.36xlarge, which provides four GPUs and Elastic Fabric Adapter (EFA) v4 networking. The tables below summarize the per-instance and composed UltraServer configurations.
| Instance Type | GPU | GPUs | GPU Memory | Memory BW | NVLink | NVLink BW | EFA | EFA BW |
|---|---|---|---|---|---|---|---|---|
| p6e-gb200.36xlarge | GB200 NVL72 | 4 | 740 GB HBM3e | — | — | — | v4 | 200 GB/s |
Note: The p6e-gb200.36xlarge EFA bandwidth is converted from the published aggregate EFA networking (4 × 400 Gbps) to GB/s (÷8); see the EC2 accelerated computing networking specifications.
| UltraServer | Component instance type | GPUs (NVLink domain) | HBM3e (aggregate) | EFA | EFA BW |
|---|---|---|---|---|---|
| u-p6e-gb200x36 | p6e-gb200.36xlarge | 36 | 6.7 TB | v4 | 1,800 GB/s |
| u-p6e-gb200x72 | p6e-gb200.36xlarge | 72 | 13.4 TB | v4 | 3,600 GB/s |
Note: UltraServer EFA bandwidth is converted from terabits per second (Tbps), as reported by AWS, to GB/s (÷8); see the P6e-GB200 UltraServers announcement and the P6 instance family page.
Resource Orchestration: Slurm and Kubernetes
When training spans hundreds or thousands of accelerators, manual resource management becomes intractable. For example, a training job requiring 512 GPUs must co-schedule 64 eight-GPU nodes (P-instances) simultaneously, and release resources atomically upon completion or failure. Both Slurm and Kubernetes address this challenge through a control-plane architecture: a centralized scheduler maintains cluster state and makes allocation decisions, while worker nodes execute assigned workloads.
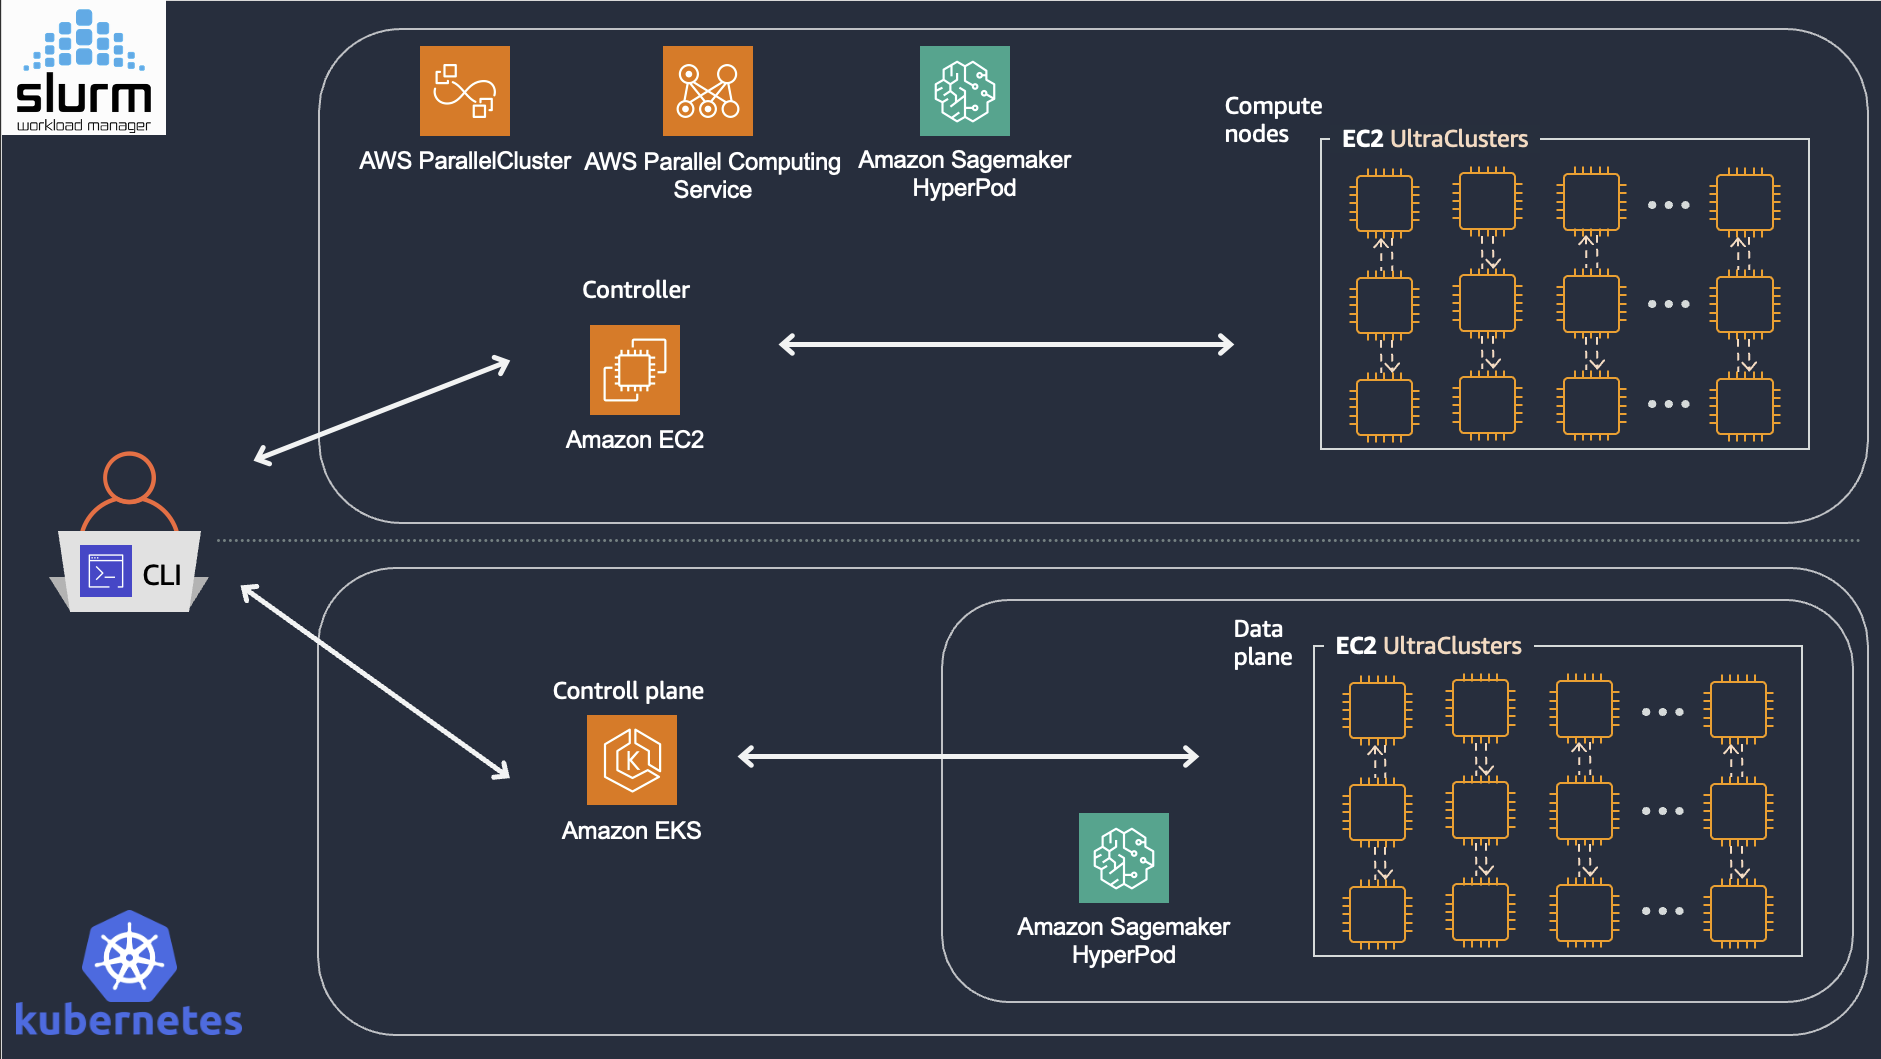 Figure 2: High-level architecture of Slurm-based and Kubernetes-based resource orchestration on AWS
Slurm (Simple Linux Utility for Resource Management) is the dominant workload manager in high-performance computing, built on a modular plugin architecture that allows the scheduling algorithm, topology model, resource types, and accounting backend to be configured independently. Its scheduling model organizes resources into partitions (logical groupings of nodes), accepts job submissions via sbatch, and launches parallel tasks via srun with synchronized startup across allocated nodes. Critically for distributed training, Slurm schedules at the job level—allocating entire multi-node jobs atomically before any task launches. A backfill scheduler starts lower-priority jobs in idle slots without delaying higher-priority ones, while a multi-factor priority system weighs fair-share usage, job age, and QOS tiers to order the queue across tenants. Slurm also supports topology-aware placement through plugins that model network switch hierarchies—on AWS, encoding the EFA fabric topology to co-locate jobs on nodes with minimal switch hops—and native GPU scheduling through its Generic Resource (GRES) interface, which tracks GPU types and enforces device affinity.
AWS provides multiple deployment options for Slurm-based orchestration. AWS ParallelCluster is an open-source cluster management tool that automates the deployment of Slurm clusters on EC2, handling head node provisioning, compute fleet scaling, and integration with shared storage. AWS Parallel Computing Service (PCS) offers an alternative that provides the managed control plane. For distributed training workloads specifically, Amazon SageMaker HyperPod supports Slurm mode with additional capabilities tailored to large-scale training, such as continuous node health monitoring and job auto-resume functionality.
Kubernetes takes a declarative, API-driven approach: users specify desired state through resource manifests, and controllers reconcile actual state to match. While Kubernetes excels at model deployment, its native scheduling model exposes several gaps for tightly coupled distributed training. Kubernetes schedules at the pod level; without job-level atomicity, a multi-node training job can partially start—some ranks running while others remain Pending—wasting GPUs or causing deadlocks. Vanilla Kubernetes also lacks batch queue semantics with priority-based backfill, built-in awareness of network fabric topology (NVLink domains, EFA interconnects) for placement of communication-heavy collectives.
Several Kubernetes-native projects address these gaps at different layers. Kueue operates as an admission controller atop the default scheduler, managing job-level gang admission, multi-tenant quotas with hierarchical fair sharing, and priority-based preemption—while delegating pod placement to the underlying scheduler. Volcano and NVIDIA KAI Scheduler take a different approach, replacing or augmenting the default scheduler to integrate gang scheduling directly with topology-aware pod placement—Volcano as a general-purpose batch scheduler, KAI Scheduler with deep NVLink/NVSwitch awareness for GPU-optimized placement. These layers are complementary: Kueue can manage admission and quota policy while passing admitted jobs to a topology-aware scheduler for placement.
For Kubernetes-based orchestration on AWS, Amazon Elastic Kubernetes Service (EKS) provides managed Kubernetes with GPU scheduling via the NVIDIA device plugin. Amazon SageMaker HyperPod also supports EKS mode, combining Kubernetes orchestration with HyperPod’s training-specific capabilities. HyperPod EKS extends EKS with features designed for foundation model training at scale. Task governance provides compute allocation and policy enforcement across teams, integrating managed Kueue for admission control and Karpenter for just-in-time node provisioning. Checkpointless training addresses the recovery latency inherent in traditional checkpoint-based fault tolerance. Rather than periodically serializing model state to shared storage, checkpointless training maintains continuous peer-to-peer state replication across GPUs. When a failure occurs, surviving nodes reconstruct the lost state through EFA-based communication rather than reading multi-terabyte checkpoints from FSx for Lustre or S3. Elastic training enables jobs to automatically scale based on resource availability. When additional accelerators become available (e.g., from completed jobs or newly provisioned capacity), elastic jobs can expand to utilize them; when higher-priority workloads require resources, jobs can contract while maintaining training progress.
ML Software Stack
Distributed training and inference involve multiple software layers that must be correctly configured and coordinated. A useful model treats the runtime stack as five layers, ordered from hardware-adjacent components (which must function correctly for anything to run) to framework-level abstractions (which determine programmer productivity and model throughput): hardware enablement, accelerator runtime and math libraries, communication substrate, ML frameworks, and distributed training/inference frameworks.
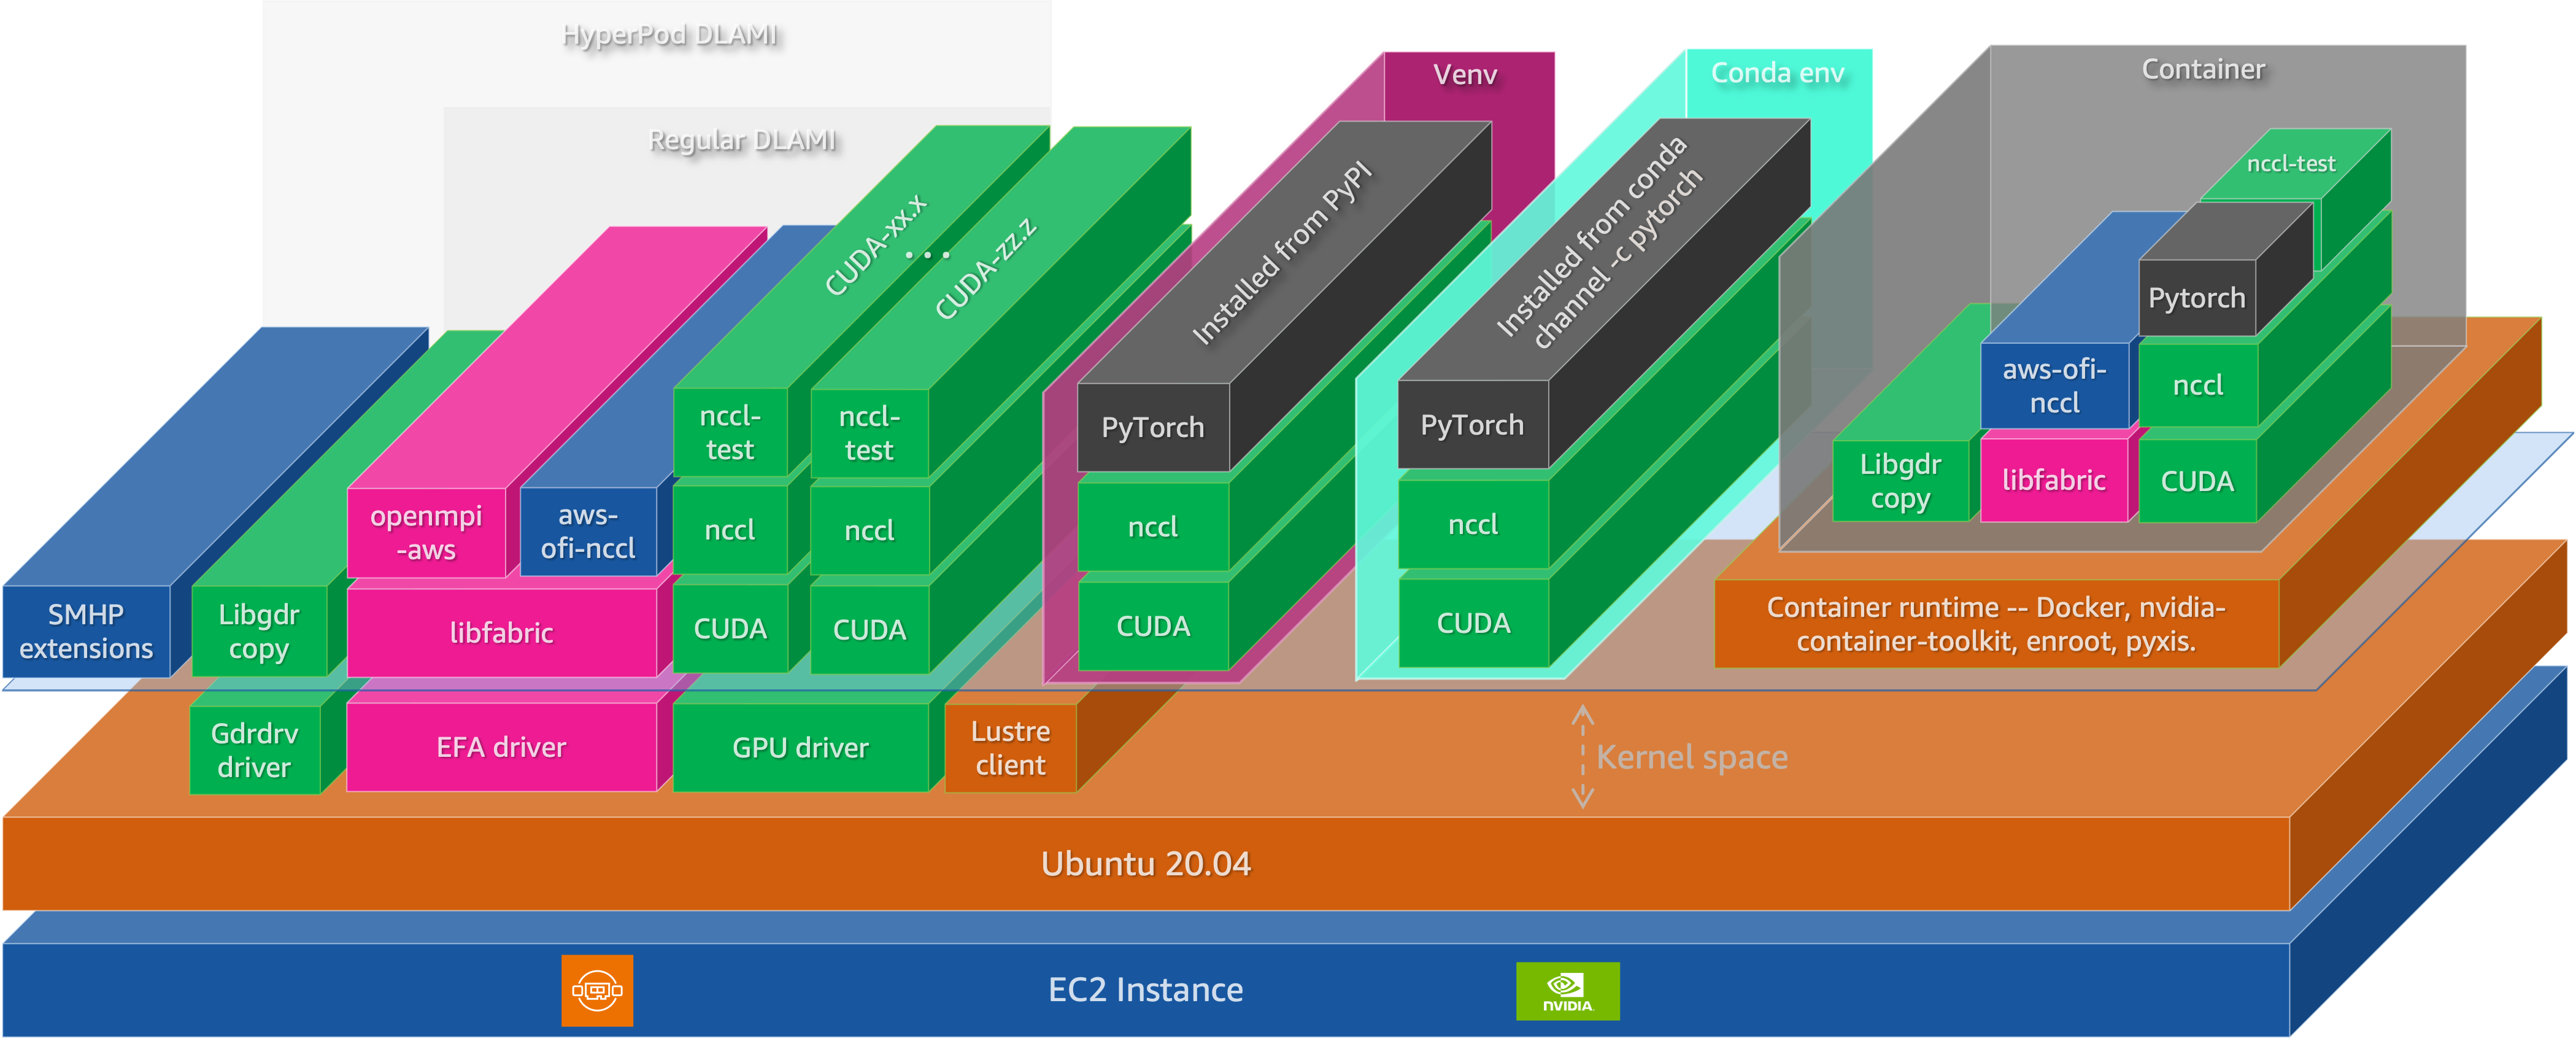 Figure 3: The ML software stack for distributed training and inference on EC2 instances
Hardware enablement: kernel drivers
At the foundation, Linux kernel drivers provide direct hardware access. The NVIDIA GPU driver exposes compute capabilities and supports GPUDirect RDMA for direct data transfers between GPUs and network adapters. The GDRCopy driver (gdrdrv) enables low-latency CPU-initiated copies to and from GPU memory, used by NCCL for small-message transfers. The EFA driver provides OS-bypass networking through the libfabric API, and the Lustre client driver enables POSIX access to FSx for Lustre parallel file systems.
Accelerator runtime, compilers, and kernel libraries
The CUDA platform provides the programming model and runtime for GPU compute. Applications compiled against CUDA can launch kernels on NVIDIA GPUs, manage device memory, and coordinate execution across multiple devices. The current release is CUDA Toolkit 13.x, with support for Blackwell architecture (compute capability 10.x).
Modern training and inference performance is increasingly driven by specialized optimization libraries and custom kernels, not just general-purpose vendor primitives. Kernels like FlashAttention fuse attention into a single memory-efficient pass, cutting HBM traffic and improving throughput. Many teams also write shape- and precision-specialized fused kernels (e.g., layernorm/residual/activation, quantized GEMMs, MoE dispatch, KV-cache ops) tuned to their exact models. This is enabled by programmable toolchains such as Triton (Python GPU kernel compiler) and NVIDIA’s CuTe (tensor layout and warp-level DSL), with libraries like CUTLASS providing highly optimized GEMM and fusion building blocks. In practice, this kernel and compiler layer often determines end-to-end performance as much as the ML framework.
Communication substrate: NCCL and transport plugins
Multi-GPU training depends on efficient collective communication. NVIDIA Collective Communications Library (NCCL) implements collective operations—all-reduce, all-gather, reduce-scatter, all-to-all, broadcast, and point-to-point send/receive—with topology-aware algorithms that exploit NVLink for intra-node communication and network transports for inter-node traffic. NCCL dynamically detects the communication topology and selects ring or tree algorithms depending on message size and available bandwidth. While data-parallel and tensor-parallel strategies rely primarily on all-reduce and all-gather, Mixture-of-Experts (MoE) models with expert parallelism depend on all-to-all collectives to route tokens between GPUs: a dispatch all-to-all sends each token to the GPU hosting its assigned expert, and a combine all-to-all returns expert outputs to the originating GPUs (NVIDIA Developer Blog). Because every GPU exchanges data with every other GPU in the expert-parallel group, all-to-all communication volume scales with the number of experts and can become a dominant bottleneck at high expert-parallelism degrees.
On AWS, NCCL’s inter-node communication is enabled through the aws-ofi-nccl plugin, which maps NCCL’s transport APIs to libfabric interfaces. This allows NCCL to leverage EFA’s OS-bypass and Scalable Reliable Datagram (SRD) protocol without application changes.
For inference workloads, collective operations do not capture all communication patterns. Disaggregated inference architectures—which separate prefill and decode phases onto distinct GPU pools—require efficient point-to-point data movement, particularly for transferring KV cache state between instances. NVIDIA Inference Xfer Library (NIXL) addresses this requirement by providing a unified API for point-to-point transfers across memory tiers (HBM, DRAM, NVMe, distributed storage) and interconnects (NVLink, InfiniBand, Ethernet). NIXL integrates with inference frameworks such as NVIDIA Dynamo and supports backends including UCX and GPUDirect Storage.
ML frameworks: PyTorch
The two dominant frameworks for foundation model development are PyTorch and JAX. JAX takes an SPMD (Single Program Multiple Data) approach through XLA, where the same program executes across devices with automatic data distribution and collective lowering. This series focuses on PyTorch, which sees broader adoption in the open-source ecosystem and forms the basis for the distributed training and inference frameworks discussed below.
PyTorch provides tensor computation with GPU acceleration, automatic differentiation, and a flexible eager-execution model. For distributed workloads, PyTorch’s torch.distributed module provides the core primitives: process groups for collective communication, and distributed data-parallel abstractions including Distributed Data Parallel (DDP) and Fully Sharded Data Parallel (FSDP2). DDP replicates models across GPUs and synchronizes gradients via all-reduce, while FSDP2 shards parameters, gradients, and optimizer states across workers using techniques from the ZeRO algorithm, enabling training of models that exceed single-GPU memory capacity.
Distributed training and inference frameworks
The top layer comprises frameworks that build on PyTorch to provide higher-level abstractions for distributed training and inference at scale. For training, three categories of frameworks address different points in the complexity-performance tradeoff. Below are few examples
Hugging Face Transformers provides the Trainer class with built-in support for distributed training via Accelerate, which abstracts over DDP, FSDP, and DeepSpeed. This path prioritizes ease of use and broad model compatibility, making it suitable for fine-tuning and moderate-scale training where configuration simplicity matters more than maximum throughput.
NVIDIA Megatron Core targets maximum efficiency at scale, implementing 3D parallelism (tensor, pipeline, and expert parallelism) with optimizations including FP8 mixed precision via Transformer Engine. Megatron Core has demonstrated training of models up to 462B parameters across thousands of GPUs, achieving up to 47% Model FLOPs Utilization on H100 clusters (NVIDIA Megatron Core). The NeMo Framework builds on Megatron Core to provide end-to-end workflows for pre-training and fine-tuning.
For reinforcement learning from human feedback (RLHF) and related post-training methods, veRL (Volcano Engine Reinforcement Learning) provides a flexible framework that implements algorithms including PPO, GRPO, and REINFORCE++. veRL’s HybridFlow architecture allows mixing training backends (FSDP2, Megatron) with inference engines (vLLM, SGLang) in the same job, avoiding weight synchronization overhead by sharing model weights in memory between actor and rollout components.
For inference serving, vLLM implements PagedAttention, managing the KV cache as paged virtual memory to reduce fragmentation and enable higher batch sizes. SGLang extends this with RadixAttention for automatic prefix reuse across requests, a zero-overhead batch scheduler that overlaps CPU scheduling with GPU computation, and a cache-aware load balancer that routes requests based on predicted cache hit rates. SGLang has been deployed at scale across over 400,000 GPUs by organizations including xAI, AMD, and NVIDIA. Both frameworks support tensor parallelism for serving models that exceed single-GPU memory, and both integrate with NVIDIA Dynamo for disaggregated serving architectures that separate prefill and decode phases.
Observability
Observability is a prerequisite for debugging and operating distributed training systems at scale. When a training job stalls or throughput degrades, practitioners need visibility into whether the cause is hardware failure, network congestion, storage bottlenecks, or application-level inefficiency. At the infrastructure scale discussed in this series—thousands of GPUs, petabits of interconnect bandwidth, and terabytes of checkpoint data—the challenge shifts from simple monitoring to systematic telemetry collection, storage, and analysis. Observability spans three telemetry categories: infrastructure metrics (GPU, network, storage), workload metrics (training throughput, queue latency), and alerting for proactive fault detection.
Core Stack: Prometheus and Grafana
The de facto standard for observability in Kubernetes and HPC environments combines Prometheus for metrics collection with Grafana for visualization and alerting. Prometheus operates on a pull-based model, periodically scraping HTTP endpoints exposed by metric exporters. Collected metrics are stored in a time-series database (TSDB) and queried via PromQL, a flexible query language for aggregation, filtering, and alerting rule evaluation. Grafana consumes Prometheus as a data source, rendering dashboards and triggering alerts based on PromQL expressions.
For production deployments, Amazon Managed Service for Prometheus (AMP) provides a fully managed, Prometheus-compatible time-series database that scales to ingest millions of samples per second without requiring operators to manage storage, replication, or high availability. Amazon Managed Grafana (AMG) offers a managed Grafana workspace with native integration to AMP and AWS authentication via IAM Identity Center. Together, these services eliminate operational overhead while preserving compatibility with existing Prometheus exporters and Grafana dashboards.
GPU, Network, and Application Telemetry
DCGM-Exporter exposes NVIDIA GPU metrics in Prometheus format, including utilization, memory usage, power, temperature, and hardware health indicators such as ECC errors and XID events. For training workloads, SM activity (DCGM_FI_PROF_SM_ACTIVE) often provides a more accurate measure of compute efficiency than basic utilization metrics.
EFA exposes driver-level statistics (bytes, packets, retransmits, timeouts) that help diagnose collective operation bottlenecks in distributed training. The aws-ofi-nccl plugin bridges NCCL to the libfabric interface, and operators can combine EFA counters with NCCL diagnostics (NCCL_DEBUG=INFO) to isolate network-layer issues.
Amazon FSx for Lustre exposes client-side metrics including throughput and metadata latency, while application-level metrics (step time, tokens per second, loss values for training; TTFT, inter-token latency for inference) can be exported via Prometheus client libraries.
GPU Health Monitoring and Alerting
Proactive fault detection prevents hardware issues from propagating into extended training interruptions. A typical workflow monitors DCGM health metrics and triggers alerts when error counts exceed thresholds. ECC single-bit errors (SBE) may be tolerable in small numbers, but accelerating SBE rates often precede double-bit errors (DBE) or other failures. XID 63 (row remap failure), XID 64 (GPU fallen off bus), and XID 94/95 (contained/uncontained errors) typically warrant immediate node replacement.
The GPU Health - Cluster dashboard (Grafana dashboard ID 21645) provides a reference visualization for common GPU error patterns. The dashboard aggregates ECC errors, XID events, thermal violations, and row remapping status across all cluster nodes, enabling operators to identify failing hardware before it impacts training jobs.
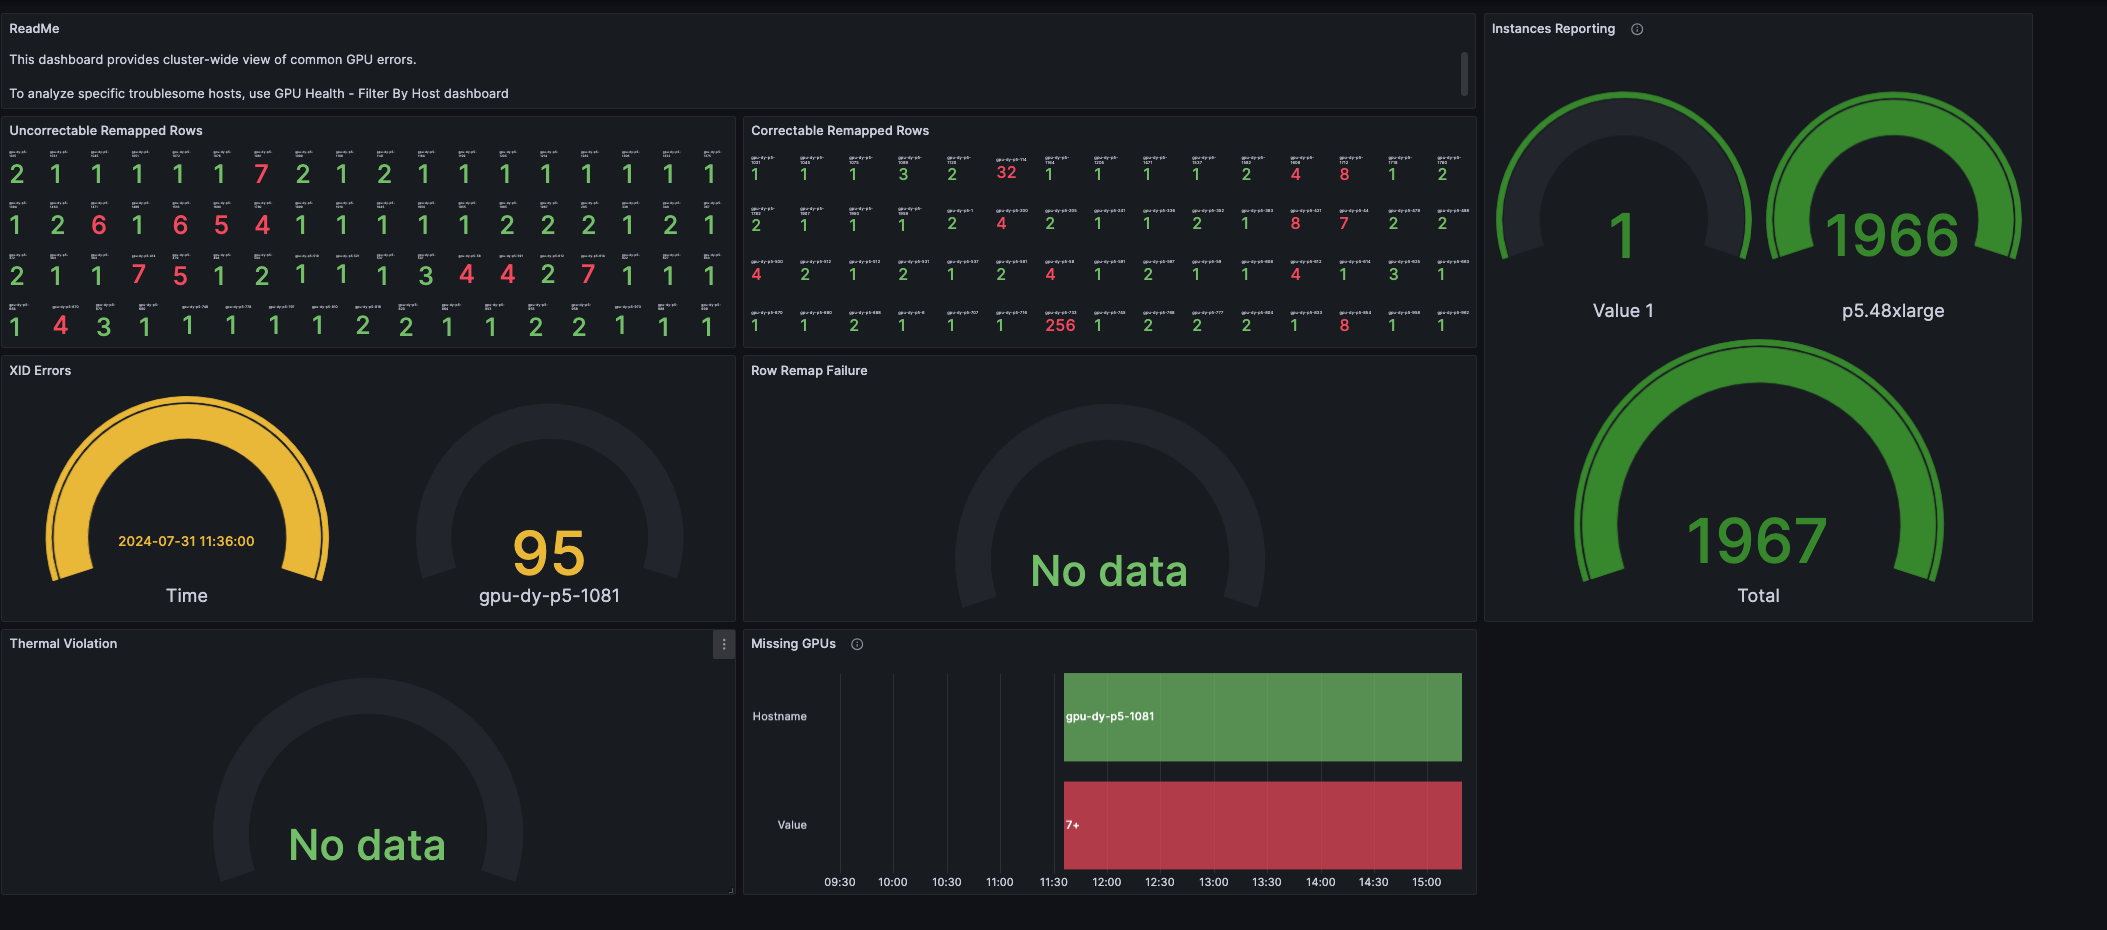 Figure 4: GPU Health - Cluster dashboard showing GPU error patterns and instance reporting
Part 5 of this series provides a comprehensive treatment of observability architecture, including metric collection strategies, dashboard configurations, and alerting patterns for maintaining cluster health at scale.
Conclusion
The shift from a single pre-training scaling law to three complementary regimes—pre-training, post-training, and test-time compute—has not fragmented infrastructure requirements; it has reinforced them. All three regimes demand tightly coupled accelerator compute, high-bandwidth low-latency networking, and scalable distributed storage, differing mainly in workload profile and resource scheduling patterns.
This post surfaced the four-layer architecture that addresses those requirements on AWS: infrastructure building blocks (EC2 P-instances, EFA networking, and tiered storage), resource orchestration (Slurm and Kubernetes with SageMaker HyperPod), the ML software stack (from kernel drivers and CUDA through NCCL to PyTorch), and observability (Prometheus, Grafana, and GPU health monitoring). Each layer constrains and enables the layers above it—a misconfigured driver or saturated network link can bottleneck an otherwise well-tuned training run just as effectively as a suboptimal parallelism strategy.
Understanding these integration points is the foundation for diagnosing performance bottlenecks and making informed scaling decisions across the foundation model lifecycle.
Authors
Aman Shanbhag is an AI Performance and Infrastructure Engineer on the MARS MLOps team at NVIDIA, where he helps research teams build scalable, high-performance ML training and inference systems. He previously worked as a Specialist Solutions Architect at AWS, supporting customers worldwide with ML training and inference optimization on AWS. Aman holds degrees in computer science, mathematics, and entrepreneurship from Rice University and focuses on AI infrastructure, performance optimization, and distributed training and inference.
Pavel Belevich is a Senior Applied Scientist in the GenAI ML Frameworks team at Amazon Web Services. He applies his research in distributed training and large-model inference to real customer workloads at production scale. Before joining AWS, Pavel worked on the PyTorch Distributed team, contributing to core distributed training techniques such as FSDP and Pipeline Parallelism. At AWS, he works on MoE communication patterns and large-scale serving/training workflows. He also regularly shares best practices through technical deep dives on expert parallelism and large-model systems.
Keita Watanabe is a Principal Solutions Architect in the GenAI ML Frameworks team at Amazon Web Services, where he specializes in ML systems performance engineering and supporting customers worldwide with ML training and inference optimization on AWS. His background is in machine learning research and development. Prior to joining AWS, Keita worked at Rakuten as a research scientist, developing an image-based product search system. Keita holds a PhD in Science from the University of Tokyo.