EMR on EKS Observability
Monitoring Amazon EMR on EKS with Amazon Managed Prometheus and Amazon Managed Grafana
In this post, we will learn to build end-to-end observability for EMR on EKS Spark workloads by leveraging Amazon Managed Service for Prometheus to collect and store the metrics generated by Spark Applications. We will then use Amazon Managed Grafana to build dashboards for monitoring use cases
Check out the full blog here
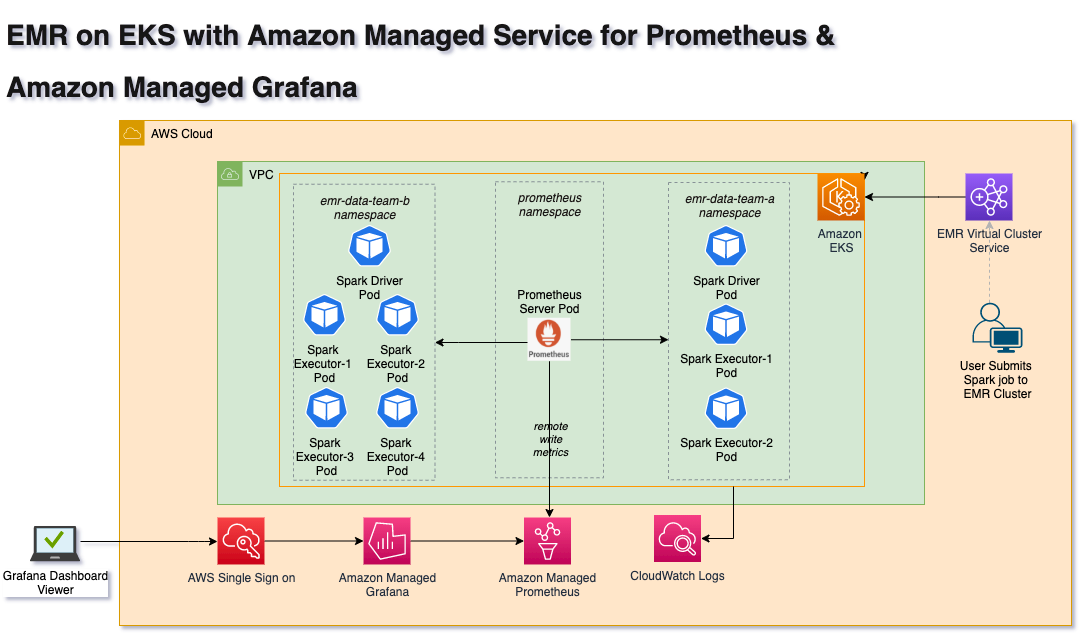
Architecture
The following diagram illustrates the solution architecture for scraping Spark Driver and Executors’ metrics, as well as writing to Amazon Managed Service for Prometheus.
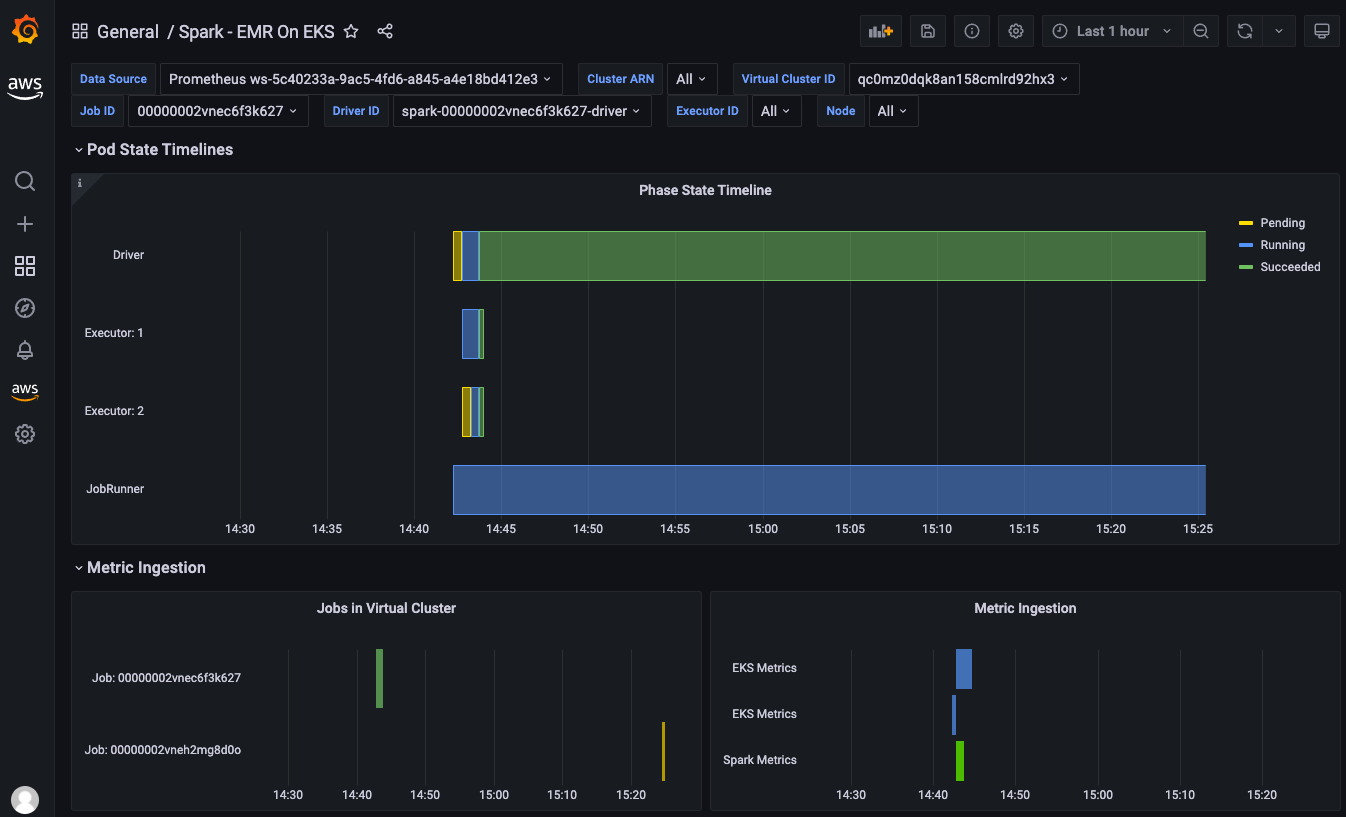
Grafana Dashboard for Spark
The following Grafana dashboard displays the EMR on EKS Spark job metrics with Driver and Executor details.