Observability Spark on EKS
Introduction
In this post, we will learn the Observability for Spark on EKS. We will use Spark History Server to watch Spark Applications logs and check the Spark job progress via the Spark Web UI. Amazon Managed Service for Prometheus is used to collect and store the metrics generated by Spark Applications and Grafana is used to build dashboards for monitoring use cases.
Deploying the Solution
We will reuse the previous Spark on Operator example. Please follow this link to provision resources
Set up data and py script
let's navigate to one example folder under spark-k8s-operator and run the shell script to upload data and py script to the S3 bucket created by terraform above.
cd data-on-eks/analytics/terraform/spark-k8s-operator/examples/cluster-autoscaler/nvme-ephemeral-storage
Run the taxi-trip-execute.sh script with the following input. You will use the S3_BUCKET variable created earlier. Additionally, you must change YOUR_REGION_HERE with the region of your choice, us-west-2 for example.
This script will download some example taxi trip data and create duplicates of it in order to increase the size a bit. This will take a bit of time and will require a relatively fast internet connection.
cd ${DOEKS_HOME}/analytics/scripts/
chmod +x taxi-trip-execute.sh
./taxi-trip-execute.sh ${S3_BUCKET} YOUR_REGION_HERE
You can return to the blueprint directory and continue with the example
cd ${DOEKS_HOME}/analytics/terraform/spark-k8s-operator
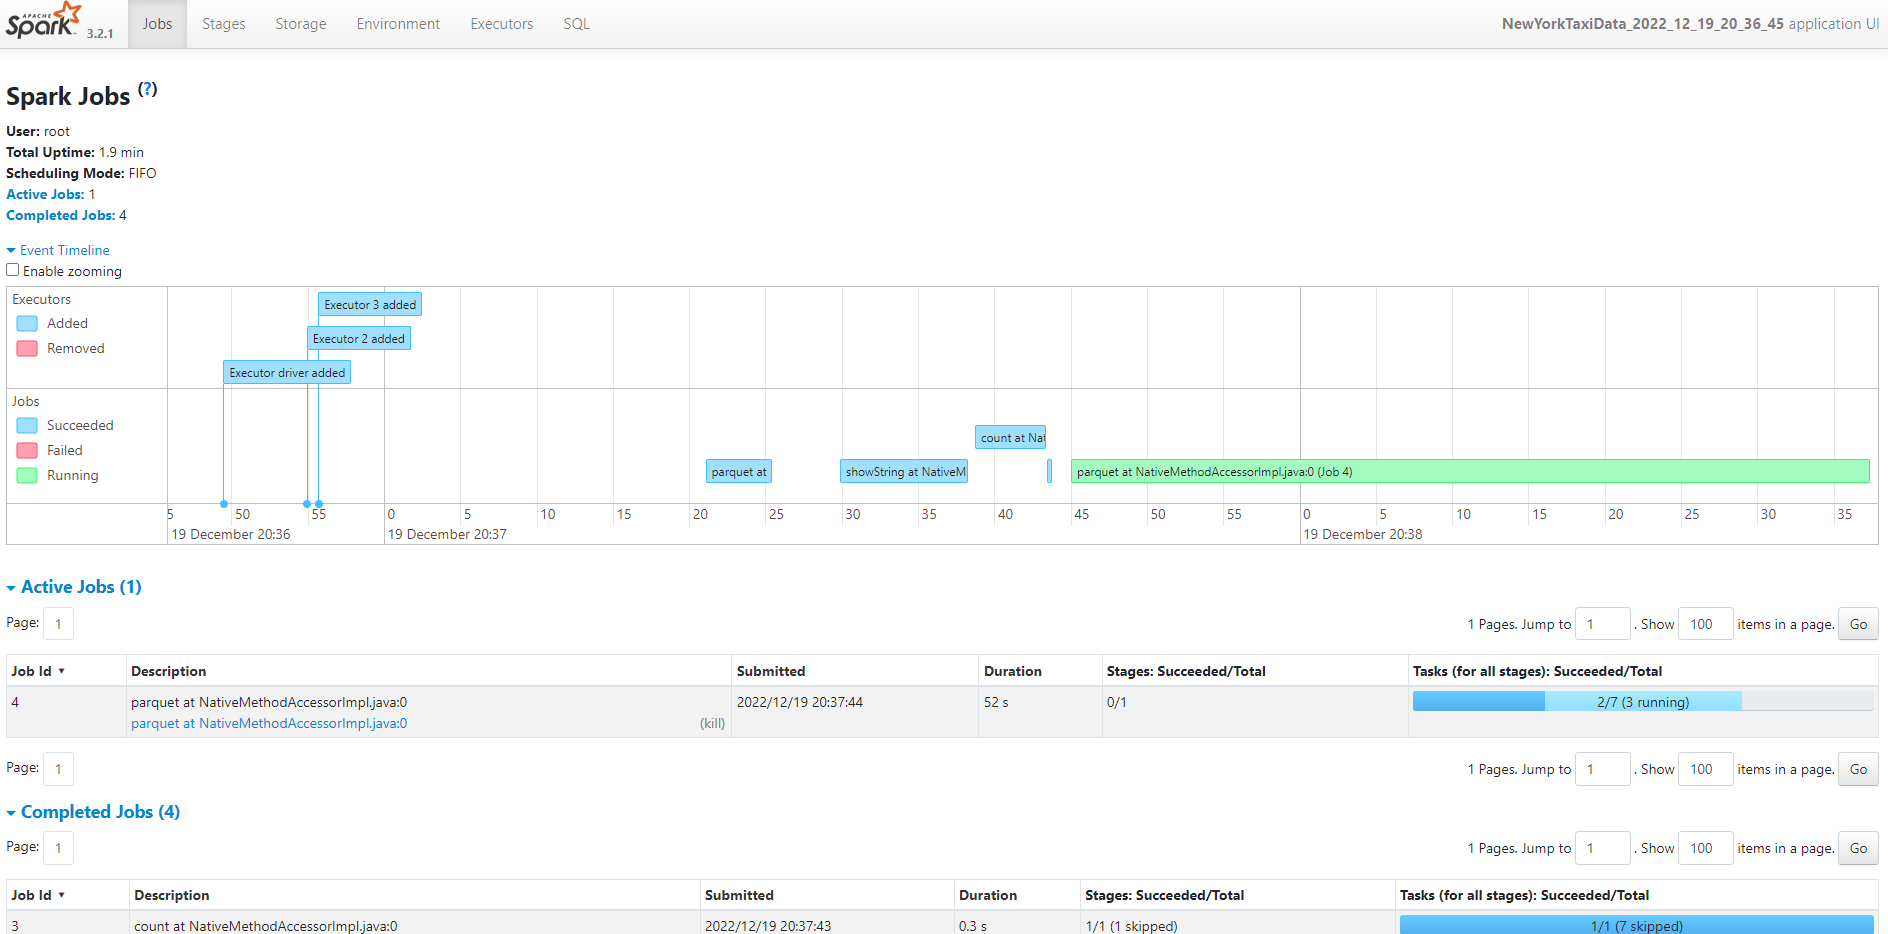
Spark Web UI
When you submit a Spark application, Spark context is created which ideally gives you Spark Web UI to monitor the execution of the application. Monitoring includes the following.
- Spark configurations used
- Spark Jobs, stages, and tasks details
- DAG execution
- Driver and Executor resource utilization
- Application logs and many more
When your application is done with the processing, Spark context will be terminated so your Web UI as well. and if you wanted to see the monitoring for already finished application, we cannot do it.
To try Spark web UI, let's update <S3_BUCKET> with your bucket name and <JOB_NAME> with "nvme-taxi-trip" in nvme-ephemeral-storage.yaml
kubectl apply -f nvme-ephemeral-storage.yaml
Then run port forward command to expose spark web service.
kubectl port-forward po/taxi-trip 4040:4040 -nspark-team-a
Then open browser and enter localhost:4040. You can view your spark application like below.
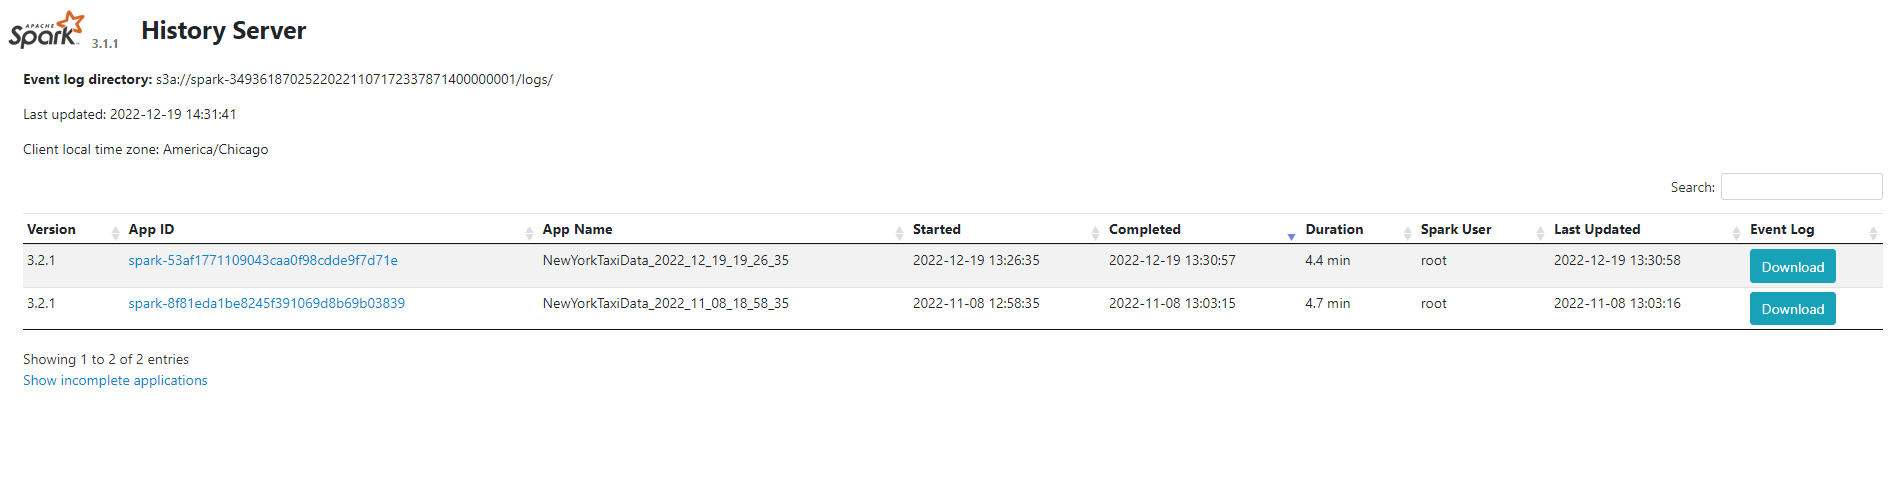
Spark History Server
As mentioned above, spark web UI will be terminated once the spark job is done. This is where Spark history Server comes into the picture, where it keeps the history (event logs) of all completed applications and its runtime information which allows you to review metrics and monitor the application later in time.
In this example, we installed Spark history Server to read logs from S3 bucket. In your spark application yaml file, make sure you have the following setting:
    sparkConf:
        "spark.hadoop.fs.s3a.aws.credentials.provider": "com.amazonaws.auth.InstanceProfileCredentialsProvider"
        "spark.hadoop.fs.s3a.impl": "org.apache.hadoop.fs.s3a.S3AFileSystem"
        "spark.eventLog.enabled": "true"
        "spark.eventLog.dir": "s3a://<your bucket>/logs/"
Run port forward command to expose spark-history-server service.
kubectl port-forward services/spark-history-server 18085:80 -n spark-history-server
Then open browser and enter localhost:18085. You can view your spark history server like below.
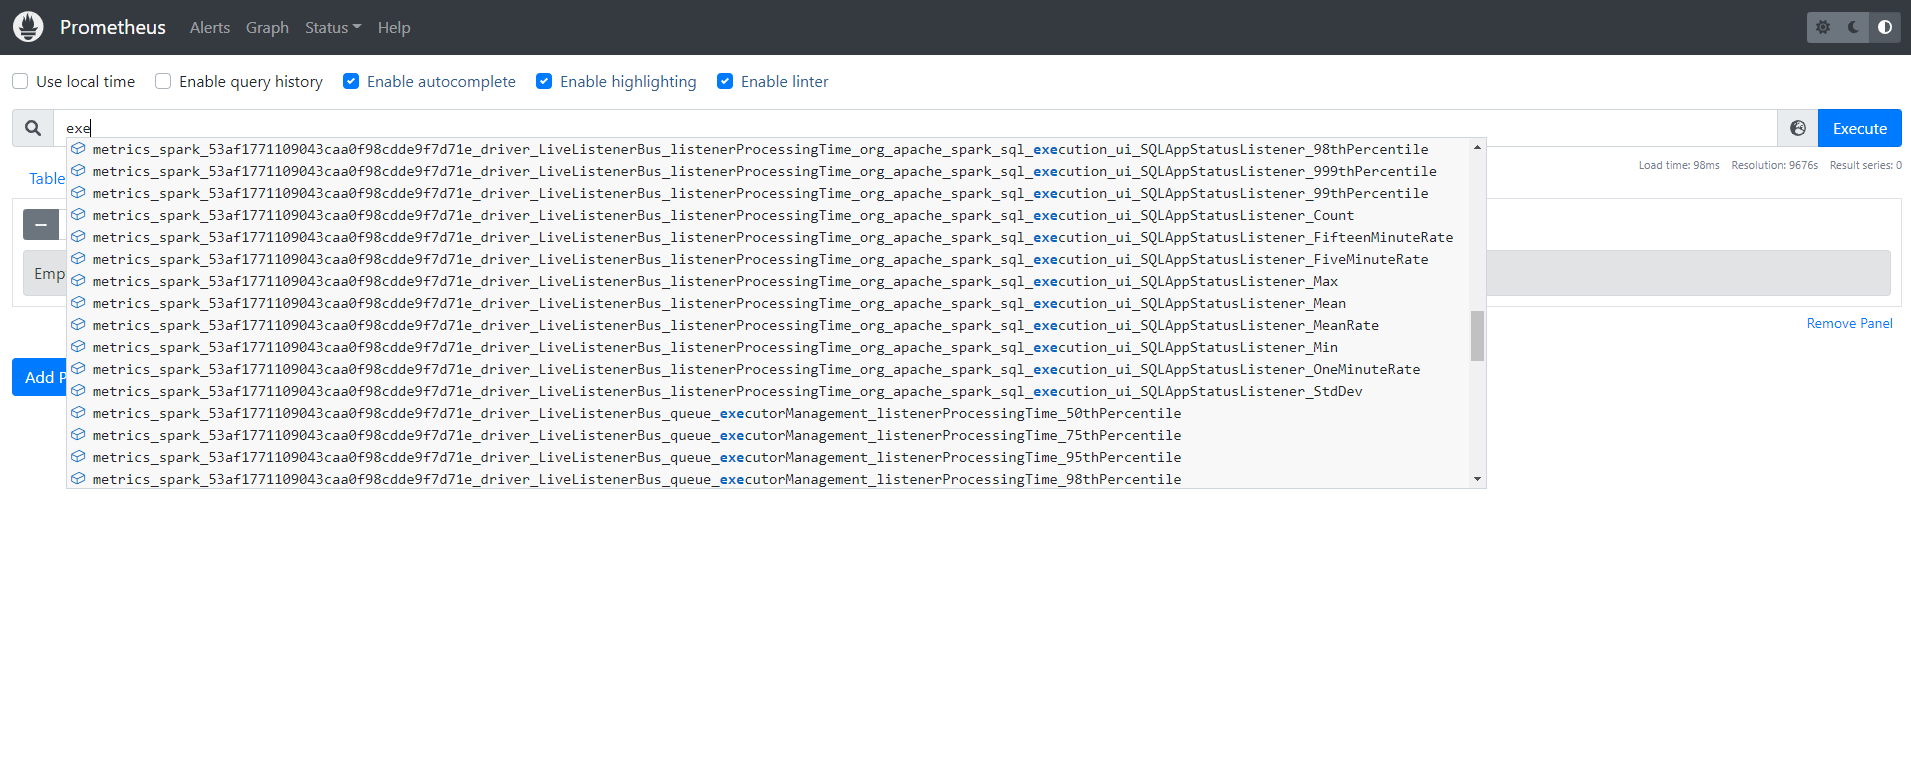
Prometheus
Spark users must add the following config to spark application yaml file to extract the metrics from Spark Driver and Executors. In the example, they are added into nvme-ephemeral-storage.yaml already.
    "spark.ui.prometheus.enabled": "true"
    "spark.executor.processTreeMetrics.enabled": "true"
    "spark.kubernetes.driver.annotation.prometheus.io/scrape": "true"
    "spark.kubernetes.driver.annotation.prometheus.io/path": "/metrics/executors/prometheus/"
    "spark.kubernetes.driver.annotation.prometheus.io/port": "4040"
    "spark.kubernetes.driver.service.annotation.prometheus.io/scrape": "true"
    "spark.kubernetes.driver.service.annotation.prometheus.io/path": "/metrics/driver/prometheus/"
    "spark.kubernetes.driver.service.annotation.prometheus.io/port": "4040"
    "spark.metrics.conf.*.sink.prometheusServlet.class": "org.apache.spark.metrics.sink.PrometheusServlet"
    "spark.metrics.conf.*.sink.prometheusServlet.path": "/metrics/driver/prometheus/"
    "spark.metrics.conf.master.sink.prometheusServlet.path": "/metrics/master/prometheus/"
    "spark.metrics.conf.applications.sink.prometheusServlet.path": "/metrics/applications/prometheus/"
Run port forward command to expose prometheus service.
kubectl port-forward service/prometheus-server 8080:80 -n prometheus
Then open browser and enter localhost:8080. You can view your prometheus server like below.
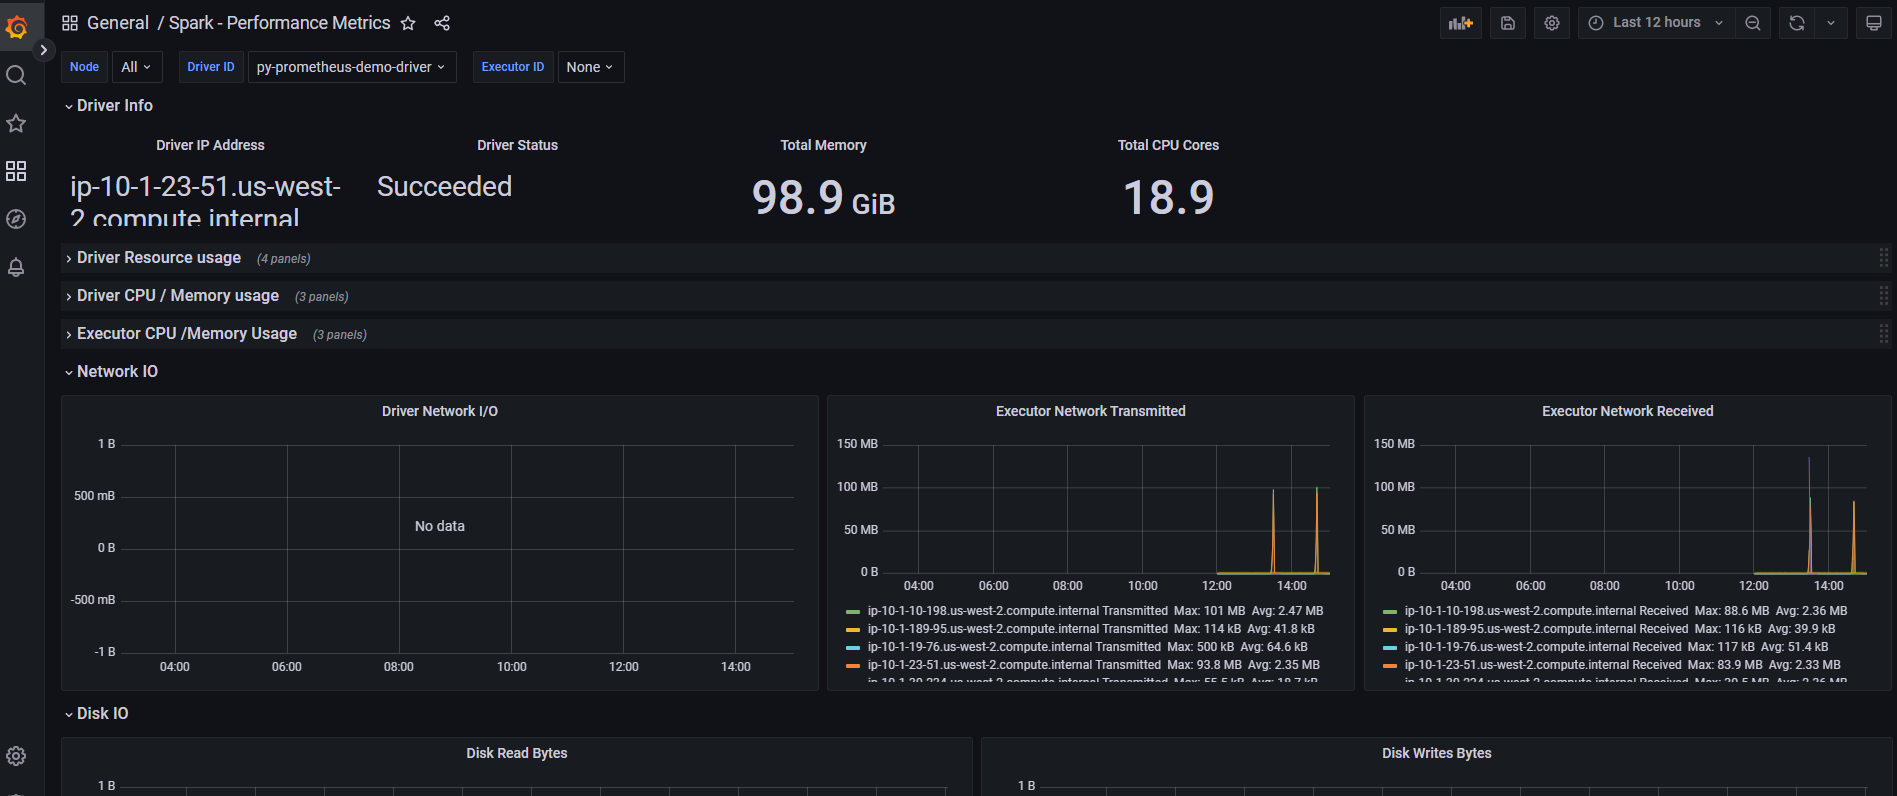
Grafana
Grafana has been installed. Use the command below to access with port forward.
get grafana password
kubectl port-forward service/grafana 8080:80 -n grafana
login username is admin and password can get from secrets manager. You can import dashboard with ID: 7890.