Distributed Data Processing with Ray Data
What is Ray Data?
Ray Data is a scalable, framework-agnostic data processing library built on top of Ray, designed for distributed data analytics and machine learning workloads. It provides:
- Distributed Processing: Parallel data processing across multiple Ray worker nodes
- Lazy Evaluation: Operations are optimized and executed only when results are needed
- Rich Data Connectors: Native support for various data sources including S3, databases, and file systems
- Memory Management: Efficient handling of large datasets that don't fit in memory
- Integration with ML Libraries: Seamless integration with pandas, NumPy, and PyArrow
Why Ray Data? Is this an Alternative Tool to Spark?
Ray Data is complementary to Spark, not a direct replacement. While both are distributed data processing frameworks, they serve different use cases:
Ray Data excels when you need:
- Python-native data processing with familiar pandas/NumPy APIs
- Tight integration with machine learning pipelines
- Real-time or streaming data processing
- Complex iterative algorithms
Spark remains ideal for:
- Large-scale ETL operations
- Complex SQL-based analytics
- Enterprise data warehouse workloads
- Cross-language support (Scala, Java, Python, R)
Problem Statement
When Apache Spark applications run on Kubernetes, they generate extensive logs that are captured by Fluent Bit and written to S3. However, these logs present several challenges for data engineers:
- Unstructured Format: Spark logs are written as raw text files without a consistent schema
- No Query Capability: Engineers cannot easily query logs using SQL-based tools like Amazon Athena
- Metadata Enrichment: Fluent Bit adds Kubernetes metadata as JSON, creating mixed formats
- Performance Issues: Scanning raw log files for troubleshooting is time-consuming and expensive
Solution: Use Ray Data to periodically process these unstructured logs, apply a consistent schema, and write them to Apache Iceberg tables. This enables:
- ✅ SQL queries via Amazon Athena
- ✅ Structured data with defined schema
- ✅ Efficient columnar storage format
- ✅ Time-travel and versioning capabilities
Log Snippet in S3 Before Processing
Here's what Spark logs look like when written to S3 by Fluent Bit:
{
  "log": "2024-01-15 14:23:45 INFO SparkContext: Running Spark version 3.5.0\n",
  "stream": "stdout",
  "time": "2024-01-15T14:23:45.123456Z",
  "kubernetes": {
    "pod_name": "spark-driver-abc123",
    "namespace_name": "spark-team-a",
    "pod_id": "12345678-1234-1234-1234-123456789012",
    "labels": {
      "spark-role": "driver",
      "spark-app-id": "spark-application-12345"
    },
    "container_name": "spark-driver",
    "container_image": "spark:3.5.0"
  }
}
{
  "log": "2024-01-15 14:23:46 INFO ResourceUtils: Using Spark's default log4j profile\n",
  "stream": "stdout",
  "time": "2024-01-15T14:23:46.234567Z",
  "kubernetes": {
    "pod_name": "spark-driver-abc123",
    "namespace_name": "spark-team-a",
    "pod_id": "12345678-1234-1234-1234-123456789012",
    "labels": {
      "spark-role": "driver",
      "spark-app-id": "spark-application-12345"
    },
    "container_name": "spark-driver",
    "container_image": "spark:3.5.0"
  }
}
Key Challenges:
- Each log line is wrapped in JSON with Kubernetes metadata
- The actual log message is embedded in the
logfield - No structured schema for querying specific log levels or components
- Redundant metadata repeated for each log line
Fluent Bit automatically enriches each log line with Kubernetes metadata including pod name, namespace, labels, and container information. This enrichment is configured in the aws-for-fluentbit-values.yaml file. While this metadata is valuable for debugging, it creates a mixed format that's difficult to query efficiently.
📋 Architecture Overview
How Ray Data Transforms Log Processing
Ray Data periodically fetches new logs from S3, processes them in parallel, and writes structured data to Apache Iceberg tables. The solution includes:
Key Features of Ray Data Processing
📊 Schema Extraction and Parsing
Ray Data intelligently extracts structured fields from unstructured logs:
- 🕐
timestamp- Parsed from the log message - 🏷️
log_level- Extracted levels (INFO, WARN, ERROR, DEBUG) - 🔧
component- Spark component (SparkContext, ResourceUtils, etc.) - 📝
message- The actual log content - 🏠
pod_name&namespace- From Kubernetes metadata - 👷
spark_role- Driver or Executor identification - 🆔
application_id- Unique Spark application identifier
🔍 Intelligent Filtering and Querying
Once processed, you can easily query logs using SQL:
-- Find all ERROR logs for a specific application
SELECT timestamp, component, message
FROM spark_logs
WHERE log_level = 'ERROR'
  AND application_id = 'spark-application-12345'
  AND timestamp > '2024-01-15 00:00:00'
ORDER BY timestamp DESC;

-- Analyze log patterns by component
SELECT component, log_level, COUNT(*) as count
FROM spark_logs
WHERE namespace = 'spark-team-a'
GROUP BY component, log_level
ORDER BY count DESC;

-- Track application lifecycle events
SELECT timestamp, message
FROM spark_logs
WHERE component = 'SparkContext'
  AND (message LIKE '%Starting%' OR message LIKE '%Stopping%')
ORDER BY timestamp;
🎯 Metadata Management
- ✅ Idempotent Processing - Tracks processed folders to avoid reprocessing
- 📋 Metadata Table - Maintains processing history and state
- 🔄 Auto-Discovery - Automatically finds new log folders in S3
- ⚡ Incremental Updates - Processes only new data for efficiency
🚀 Getting Started
Prerequisites
Before deploying this blueprint, ensure you have:
- ✅ S3 bucket with Spark application logs: Follow the Spark Operator blueprint to generate Spark logs. Note: Execute the steps in Put sample data in S3 section of the Execute Sample Spark job with Karpenter step to populate the S3 bucket with Spark Application Logs.
- ✅ AWS CLI configured with appropriate permissions
- ✅ kubectl
- ✅ Terraform installed (>= 1.0)
The Ray Data pipeline processes Spark application logs. Make sure you've run the taxi-trip example from the Spark Operator blueprint to populate your S3 bucket with logs.
📁 Spark Logfile Structure in S3:
s3://${S3_BUCKET}/
└── spark-application-logs/
    └── spark-team-a/
        ├── spark-application-1234567890-driver/
        │   └── stdout
        ├── spark-application-1234567890-exec-1/
        │   └── stdout
        └── spark-application-1234567890-exec-2/
            └── stdout
Each stdout file contains JSON-formatted logs with Kubernetes metadata enrichment from Fluent Bit.
Step 1: Enable Ray Data Processing
Deploy the EKS cluster with Ray Data components by enabling the enable_raydata variable. This will install:
- KubeRay Operator - Manages Ray clusters on Kubernetes
- Ray Custom Resources - RayJob and RayCluster CRDs
- AWS Resources - IAM roles, S3 access policies, and Glue database
- Ray Data Pipeline - Namespace, service accounts, and RBAC
- Using Terraform
- Using Install Script
cd analytics/terraform/spark-k8s-operator

# Deploy EKS cluster with Ray Data support enabled
export TF_VAR_enable_raydata=true

terraform init
terraform plan
terraform apply -auto-approve
cd analytics/terraform/spark-k8s-operator

# Set environment variables and run install script
export TF_VAR_enable_raydata=true

./install.sh
The full deployment takes approximately 20-25 minutes to create the EKS cluster, install operators, and configure all Ray Data components.
This deployment creates:
- 🎯 KubeRay Operator for Ray job orchestration
- 🔐 Ray Service Account with IRSA (IAM Roles for Service Accounts)
- 📝 IAM Roles with S3 and Glue permissions
- 📊 AWS Glue Database for Iceberg catalog
- 🌐 Kubernetes Namespace (
raydata)
Step 2: Verify KubeRay Operator Installation
Confirm that the KubeRay Operator is running successfully:
kubectl get po -n kuberay-operator
Expected output:
NAME                                READY   STATUS    RESTARTS   AGE
kuberay-operator-74fcdcc6bf-gpl5p   1/1     Running   0          10h
Step 3: Configure Ray Job
Navigate to the example directory and update the S3 configuration in the deployment script.
cd examples/raydata-sparklogs-processing-job
Replace S3_BUCKET, CLUSTER_NAME and AWS_REGION variables in the execute-rayjob.sh shell script before running.
Step 4: Deploy the Ray Cluster & Execute Ray Job
# Make script executable
chmod +x execute-rayjob.sh

# Deploy the processing job
./execute-rayjob.sh deploy
📊 Monitoring the RayJob Deployment
Check Job Status
Monitor your Ray job with these commands:
# Monitor job progress in real-time
./execute-rayjob.sh monitor

# Check current status
./execute-rayjob.sh status

# View processing logs
./execute-rayjob.sh logs
Check RayJob Logs
2025-07-27 22:04:46,324 - spark-log-processor - INFO - ✅ Successfully processed 1287 records from spark-fb094270bf654473b372d0f773e86687
2025-07-27 22:04:46,324 - spark-log-processor - INFO - 🎯 Processing Summary:
2025-07-27 22:04:46,324 - spark-log-processor - INFO -   📊 Total records processed: 1287
2025-07-27 22:04:46,324 - spark-log-processor - INFO -   ✅ Successful folders: 1
2025-07-27 22:04:46,324 - spark-log-processor - INFO -   ❌ Failed folders: 0
2025-07-27 22:04:46,324 - spark-log-processor - INFO -   ✅ Successfully processed: ['spark-fb094270bf654473b372d0f773e86687']
2025-07-27 22:04:46,324 - spark-log-processor - INFO - ✅ Metadata-driven incremental processing completed
When you deploy the RayJob, the following automated process occurs:
- 🚀 Ray Cluster Initialization - KubeRay Operator creates a Ray cluster with head and worker nodes
- 🔍 S3 Discovery - Ray Data scans the configured S3 bucket path for folders matching
spark-*pattern - 📊 Metadata Check - Queries the Iceberg metadata table to identify unprocessed folders
- 📥 Parallel Processing - Ray workers read JSON log files from S3 in parallel
- 🔄 Data Transformation - Extracts structured fields from JSON logs (timestamp, log level, component, etc.)
- ✍️ Iceberg Writing - Writes transformed data to Apache Iceberg tables with ACID guarantees
- 📝 Metadata Update - Records processing status in metadata table for idempotency
- 🎯 Completion - Shuts down Ray cluster after successful processing
The entire process is idempotent - you can safely re-run it without duplicating data, as it only processes new log folders.
Access Ray Dashboard
🎨 Ray Dashboard Access
👈✅ Data Verification
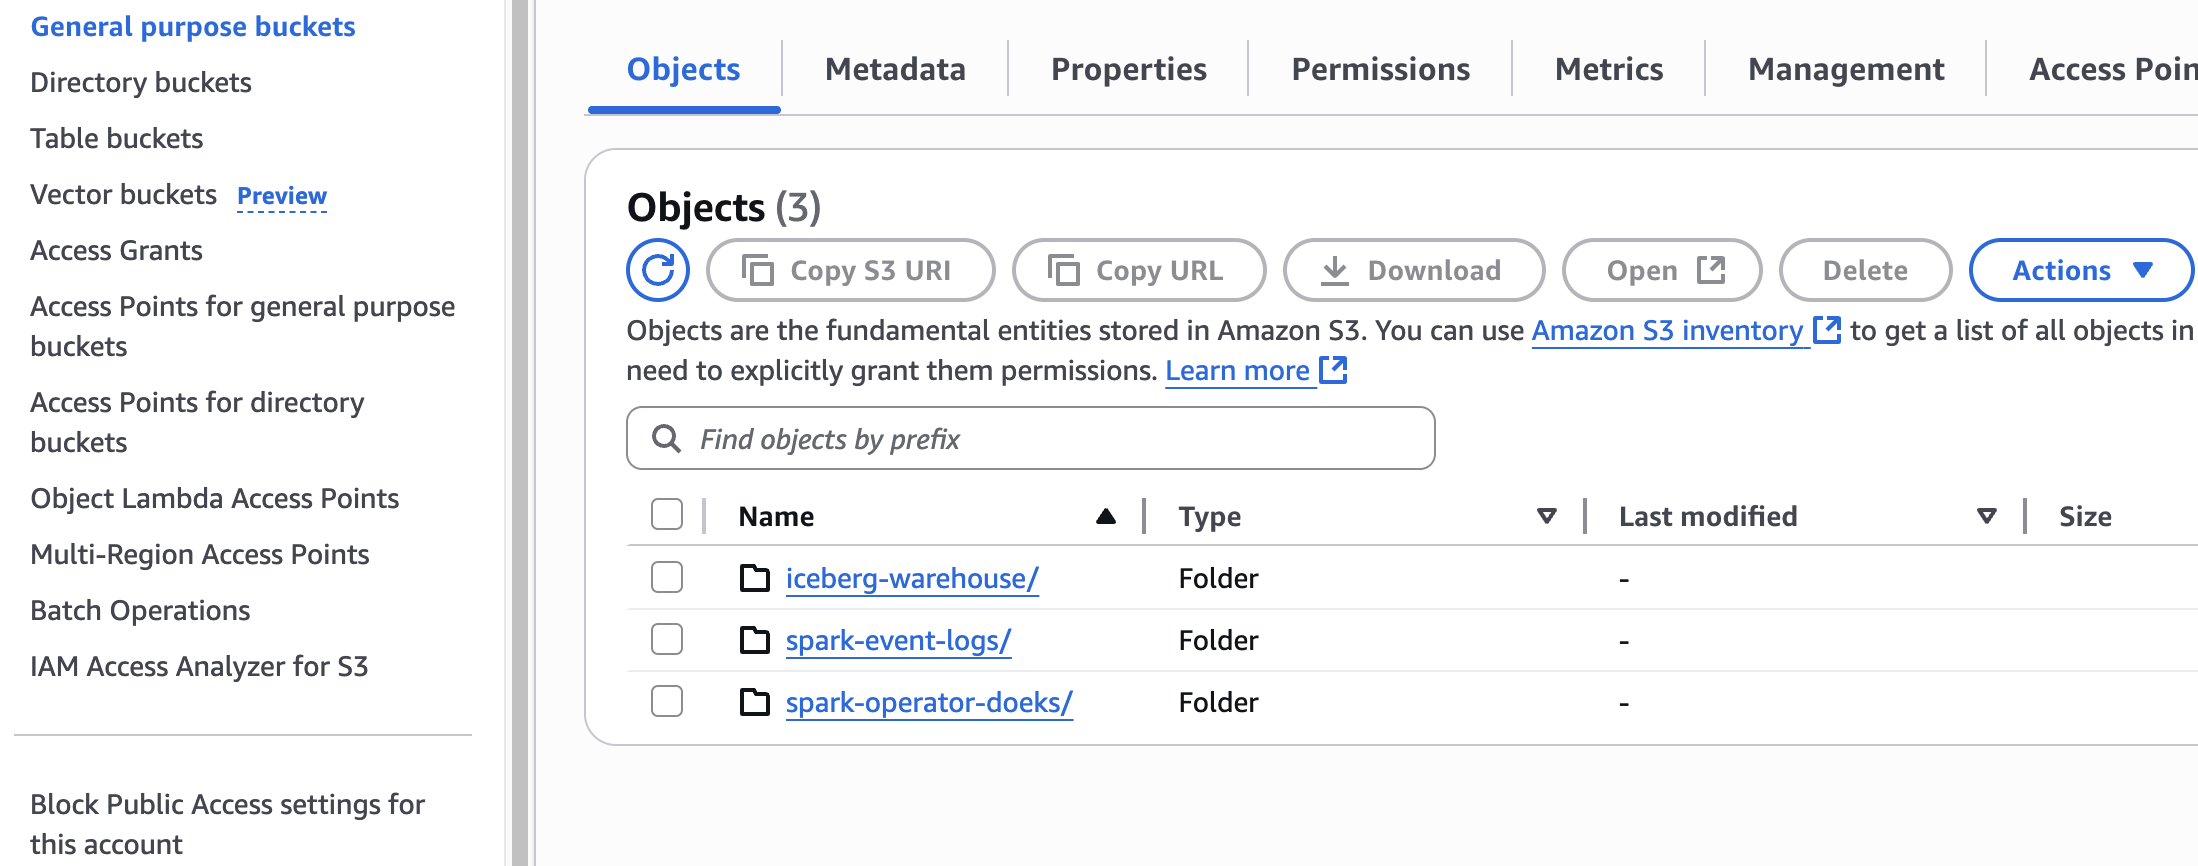
S3 Bucket Structure
Ray Data uses the same S3 bucket for both input Spark logs and output Iceberg data, organized in separate paths:
s3://your-spark-logs-bucket/
├── spark-application-logs/           # 📥 Input: Raw Spark logs from Fluent Bit
│   └── spark-team-a/
│       ├── spark-application-1234567890-driver/
│       │   └── stdout                # JSON logs with Kubernetes metadata
│       ├── spark-application-1234567890-exec-1/
│       │   └── stdout
│       └── spark-application-1234567890-exec-2/
│           └── stdout
│
└── iceberg-warehouse/                # 📤 Output: Processed Iceberg data
    └── raydata_spark_logs.db/
        └── spark_logs/
            ├── metadata/             # Iceberg metadata files
            │   ├── 00000-xxx.metadata.json
            │   ├── snap-xxx.avro     # Snapshots for time travel
            │   └── version-hint.text
            └── data/                 # Actual data in Parquet format
                ├── 00000-0-xxx.parquet
                ├── 00001-0-xxx.parquet
                └── ...
- Input Path:
s3://bucket/spark-application-logs/- Contains raw JSON logs - Output Path:
s3://bucket/iceberg-warehouse/- Contains structured Parquet files - Storage Format: Iceberg uses efficient columnar Parquet format with metadata for ACID transactions
In AWS S3 Console, it should looks like below:
Log Snippet After RayData Processing
Here's how the data transformation looks before and after Ray Data processing:
- Before Processing (Raw S3 JSON)
- After Processing (Structured Iceberg)
Raw Fluent Bit logs in S3 - Each log line wrapped in JSON with redundant metadata:
{
  "log": "2024-01-15 14:23:45 INFO SparkContext: Running Spark version 3.5.0\n",
  "stream": "stdout",
  "time": "2024-01-15T14:23:45.123456Z",
  "kubernetes": {
    "pod_name": "spark-driver-abc123",
    "namespace_name": "spark-team-a",
    "pod_id": "12345678-1234-1234-1234-123456789012",
    "labels": {
      "spark-role": "driver",
      "spark-app-id": "spark-application-12345"
    },
    "container_name": "spark-driver",
    "container_image": "spark:3.5.0"
  }
}
{
  "log": "2024-01-15 14:23:46 ERROR TaskSchedulerImpl: Lost executor 1: Container killed\n",
  "stream": "stderr",
  "time": "2024-01-15T14:23:46.234567Z",
  "kubernetes": {
    "pod_name": "spark-executor-def456",
    "namespace_name": "spark-team-a",
    "labels": {
      "spark-role": "executor",
      "spark-app-id": "spark-application-12345"
    }
  }
}
Processed data in Apache Iceberg - Clean, structured schema optimized for querying:
-- Query the processed data
SELECT * FROM raydata_spark_logs.spark_logs LIMIT 2;
| timestamp | log_level | component | message | pod_name | namespace | spark_role | application_id |
|---|---|---|---|---|---|---|---|
| 2024-01-15 14:23:45 | INFO | SparkContext | Running Spark version 3.5.0 | spark-driver-abc123 | spark-team-a | driver | spark-application-12345 |
| 2024-01-15 14:23:46 | ERROR | TaskSchedulerImpl | Lost executor 1: Container killed | spark-executor-def456 | spark-team-a | executor | spark-application-12345 |
✅ Key Improvements:
- Structured Fields - Easy to query specific log levels, components, and time ranges
- Deduplicated Metadata - No redundant Kubernetes metadata per log line
- Columnar Storage - Efficient storage and query performance with Parquet format
- Schema Evolution - Add new fields without breaking existing queries
- ACID Transactions - Consistent reads even during concurrent processing
Option 1: Query Iceberg Tables
Use the built-in data verification script provided in the blueprint that automatically sets up a Python virtual environment and all required dependencies:
from your environment.
# Make script executable
chmod +x verify-iceberg-data.sh
Replace S3_BUCKET and AWS_REGION variables in the verify-iceberg-data.sh shell script before running.
./verify-iceberg-data.sh
The script automatically...
- ✅ Creates an isolated Python virtual environment
- ✅ Installs PyIceberg and all dependencies (
pyiceberg[glue,s3fs]==0.7.0) - ✅ Connects to AWS Glue catalog and Iceberg tables
- ✅ Performs comprehensive data validation
- ✅ Cleans up temporary files and environment after completion
📋 Sample Script Output
👈Option 2: Use AWS CLI
Check table metadata without querying data:
# View Iceberg table in Glue catalog
aws glue get-table \
  --database-name raydata_spark_logs \
  --name spark_logs \
  --query 'Table.StorageDescriptor.Location'
🧹 Cleanup
To clean up resources:
# Remove Ray job only (preserve infrastructure)
./execute-rayjob.sh cleanup

# Remove all infrastructure
cd analytics/terraform/spark-k8s-operator
terraform destroy -var="enable_raydata_processing=true"
🌟 Scale Your Data Pipeline
- Scale Processing: Adjust Ray worker counts in
rayjob.yamlfor larger workloads - Add Analytics: Create dashboards using Amazon QuickSight or Grafana
- Automate: Schedule regular processing with Kubernetes CronJobs
- Extend: Process other data types like metrics, events, or application data
This blueprint demonstrates how Ray Data and Apache Iceberg can work together to build scalable, reliable data processing pipelines on Amazon EKS. The combination provides a modern data lake architecture with distributed processing capabilities, ACID transactions, and intelligent metadata management.