Deploying Apache Pinot (🍷) on EKS
Apache Pinot is real-time distributed OLAP datastore, purpose built for low-latency and high-throughput analytics. You can use pinot to ingest and immediately query data from streaming or batch data sources e.g. Apache Kafka, Amazon Kinesis Data Streams, Amazon S3, etc).
Apache Pinot includes the following characteristics:
- Ultra low-latency analytics even at extremely high throughput.
- Columnar data store with several smart indexing and pre-aggregation techniques.
- Scaling up and out with no upper bound.
- Consistent performance based on the size of your cluster and an expected query per second (QPS) threshold.
It's a perfect solution for user-facing real-time analytics and other analytical use cases, including internal dashboards, anomaly detection, and ad hoc data exploration. You can learn more about Apache Pinot and its components in its documentation.
In this blueprint, we will deploy Apache Pinot on Kubernetes cluster managed by Elastic Kubernetes Service (EKS). Some of the benefits of deploying Apache Pinot on EKS cluster are
- Manage Apache Pinot Cluster using Kubernetes
- Scale each layer independently
- No single point of failure
- Auto recovery
Architecture
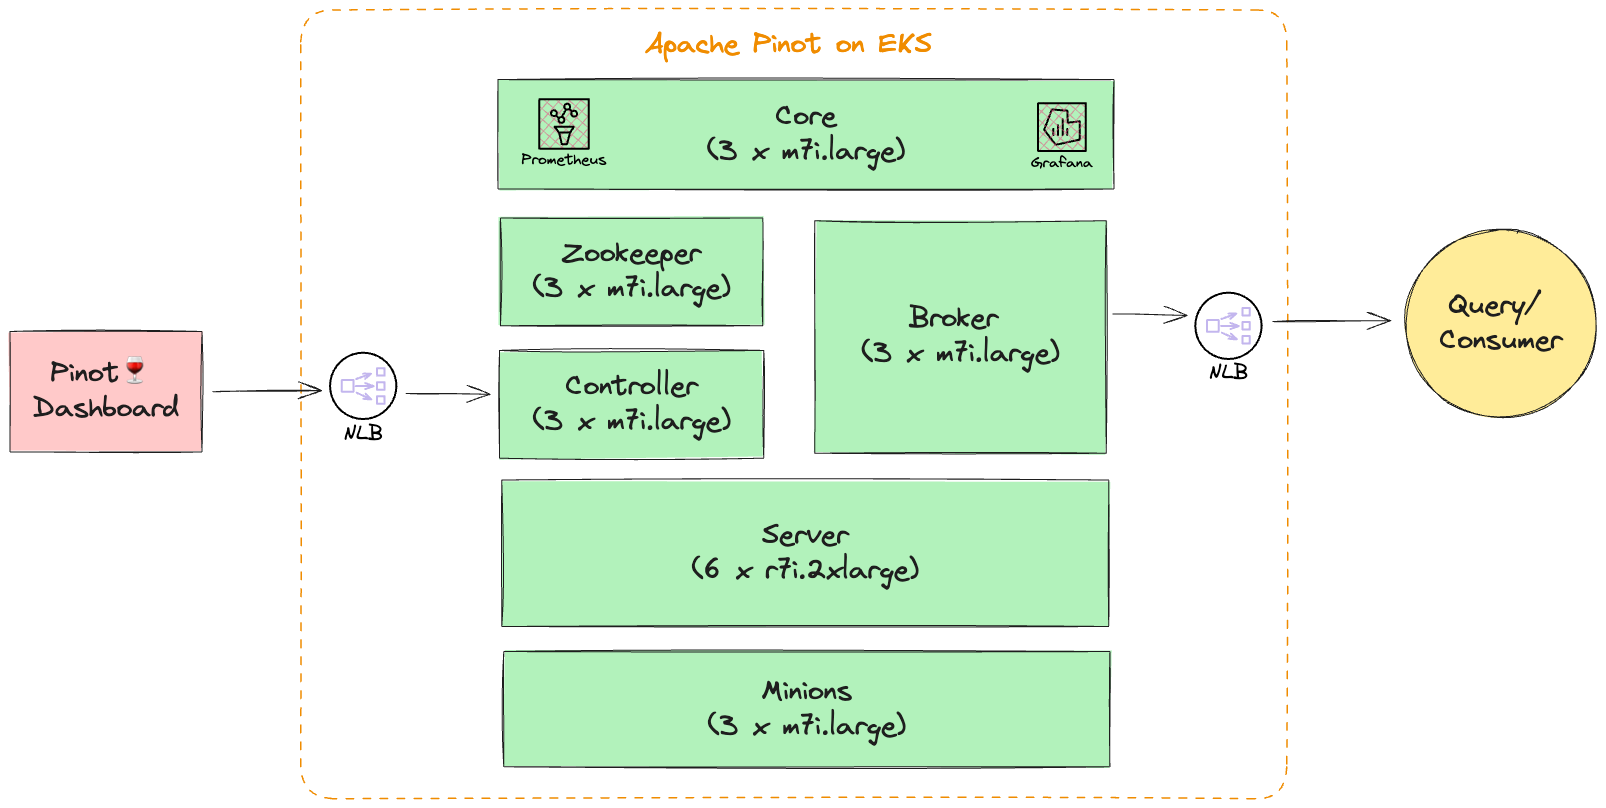
In this setup we deploy all Apache Pinot components in private subnets across 3 availability zones. This allows for greater flexibility and resilience. Most pinot components can run on latest generation general purpose compute instances (m7i) except for server component which requires memory optimized instance types (r7i). We also setup internal NLB to easily communicate with Controller and Broker components.
Note: All Apache Pinot components run on
StatefulSet.
Note: This blueprint doesn't leverage DeepStore currently and uses EBS volumes to store table segments on server.
Note: Based on your use case, you will need to update the cluster size and configuration to better suite your use case. You can read more about Apache Pinot capacity planning here and here.
Prerequisites 📝
Ensure that you have following tools installed on your machine.
Deployment ⚙️
Deploy the EKS Cluster with Apache Pinot
First, clone the repository.
git clone https://github.com/awslabs/data-on-eks.git
Navigate to apache pinot folder and create terraform.tfvars to provide desired values for all the variables. This is also the time to update any other input variables or make any other changes to the terraform template.
cd data-on-eks/distributed-databases/pinot
touch terraform.tfvars
Sample terraform.tfvars
name                = "pinot-on-eks"
region              = "us-west-2"
eks_cluster_version = "1.25"
...
Once you have updated your variables, you can run the install script to deploy your pre-configured EKS cluster with Apache Pinot.
./install.sh
Verify Deployment
Verify the Amazon EKS Cluster
aws eks describe-cluster --name pinot-on-eks
Update local kubeconfig so we can access kubernetes cluster.
aws eks update-kubeconfig --name pinot-on-eks --region us-west-2
First, lets verify that we have worker nodes running in the cluster.
kubectl get nodes
Output
NAME                                         STATUS   ROLES    AGE   VERSION
ip-10-1-189-200.us-west-2.compute.internal   Ready    <none>   12d   v1.24.17-eks-43840fb
ip-10-1-46-117.us-west-2.compute.internal    Ready    <none>   12d   v1.24.17-eks-43840fb
ip-10-1-84-80.us-west-2.compute.internal     Ready    <none>   12d   v1.24.17-eks-43840fb
Next, lets verify all the pods are running.
kubectl get pods -n pinot
Output
NAME                                                   READY   STATUS      RESTARTS   AGE
pinot-broker-0                                         1/1     Running     0          11d
pinot-broker-1                                         1/1     Running     0          11d
pinot-broker-2                                         1/1     Running     0          11d
pinot-controller-0                                     1/1     Running     0          11d
pinot-controller-1                                     1/1     Running     0          11d
pinot-controller-2                                     1/1     Running     0          11d
pinot-minion-stateless-86cf65f89-rlpwn                 1/1     Running     0          12d
pinot-minion-stateless-86cf65f89-tkbjf                 1/1     Running     0          12d
pinot-minion-stateless-86cf65f89-twp8n                 1/1     Running     0          12d
pinot-server-0                                         1/1     Running     0          11d
pinot-server-1                                         1/1     Running     0          11d
pinot-server-2                                         1/1     Running     0          11d
pinot-zookeeper-0                                      1/1     Running     0          12d
pinot-zookeeper-1                                      1/1     Running     0          12d
pinot-zookeeper-2                                      1/1     Running     0          12d
We have also deployed prometheus and grafana under monitoring namespace. So also make sure all the pods for monitoring are also running.
kubectl get pods -n monitoring
Output
prometheus-grafana-85b4584dbf-4l72l                    3/3     Running   0          12d
prometheus-kube-prometheus-operator-84dcddccfc-pv8nv   1/1     Running   0          12d
prometheus-kube-state-metrics-57f6b6b4fd-txjtb         1/1     Running   0          12d
prometheus-prometheus-kube-prometheus-prometheus-0     2/2     Running   0          4d3h
prometheus-prometheus-node-exporter-4jh8q              1/1     Running   0          12d
prometheus-prometheus-node-exporter-f5znb              1/1     Running   0          12d
prometheus-prometheus-node-exporter-f9xrz              1/1     Running   0          12d
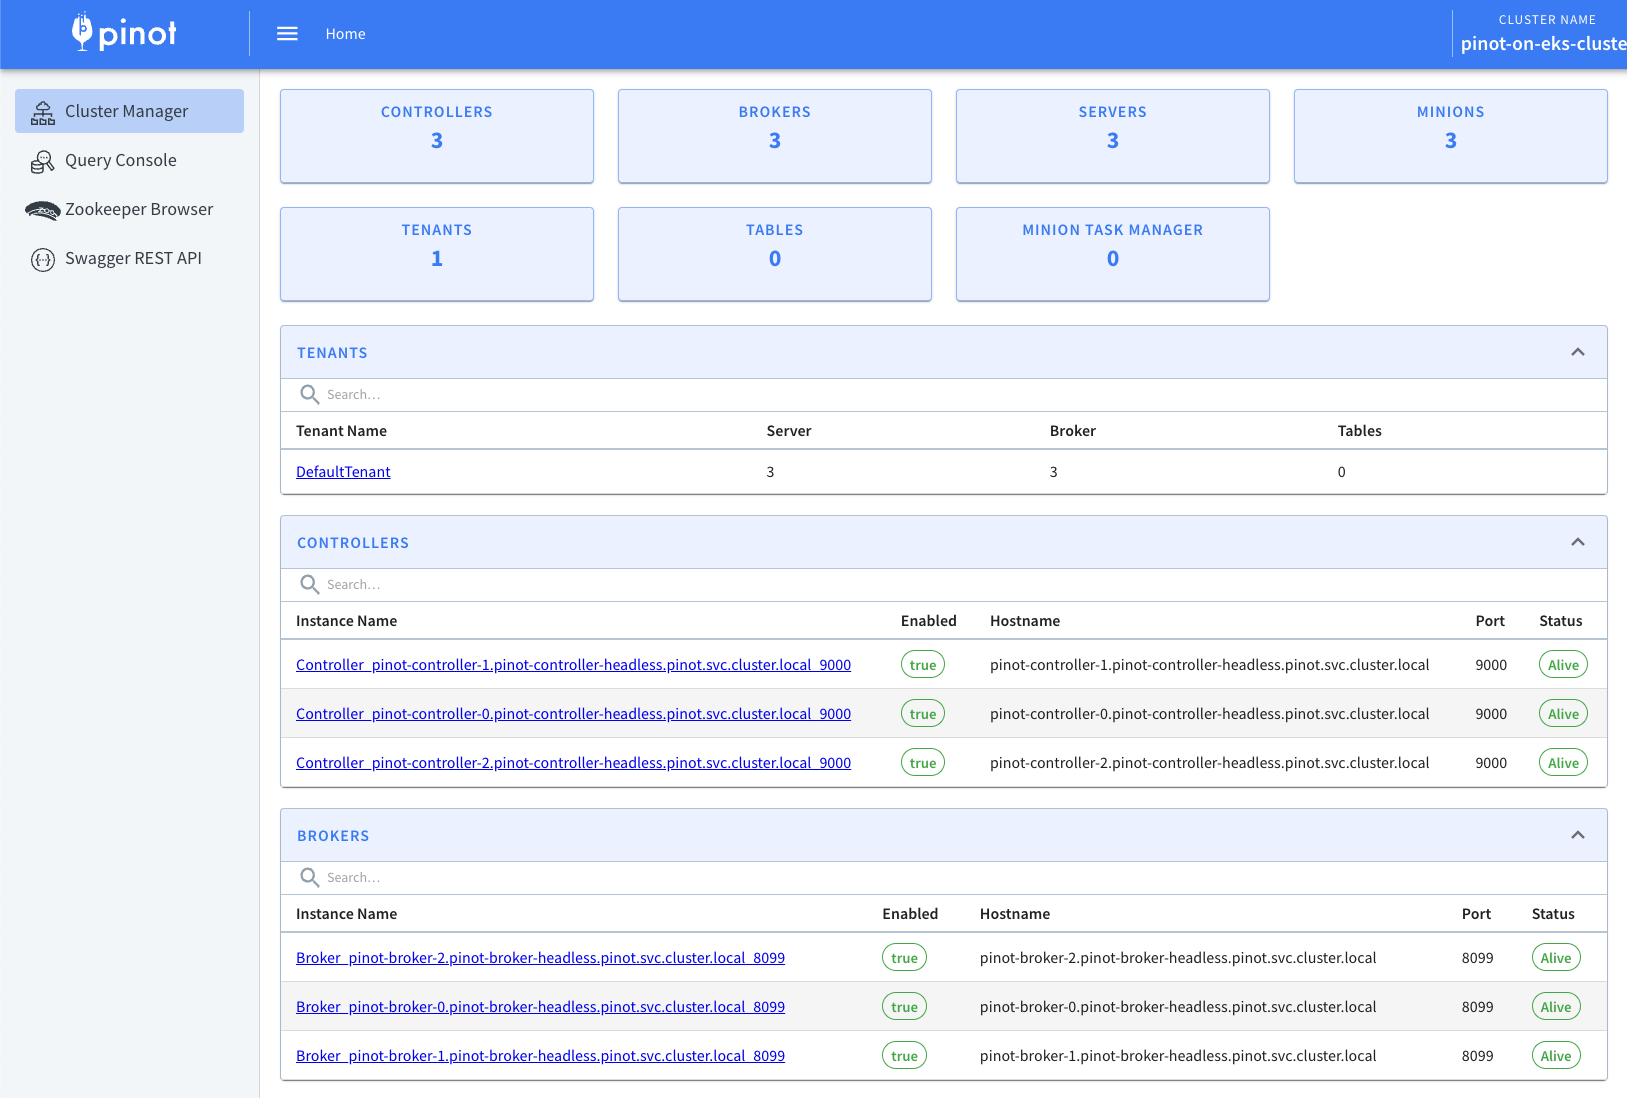
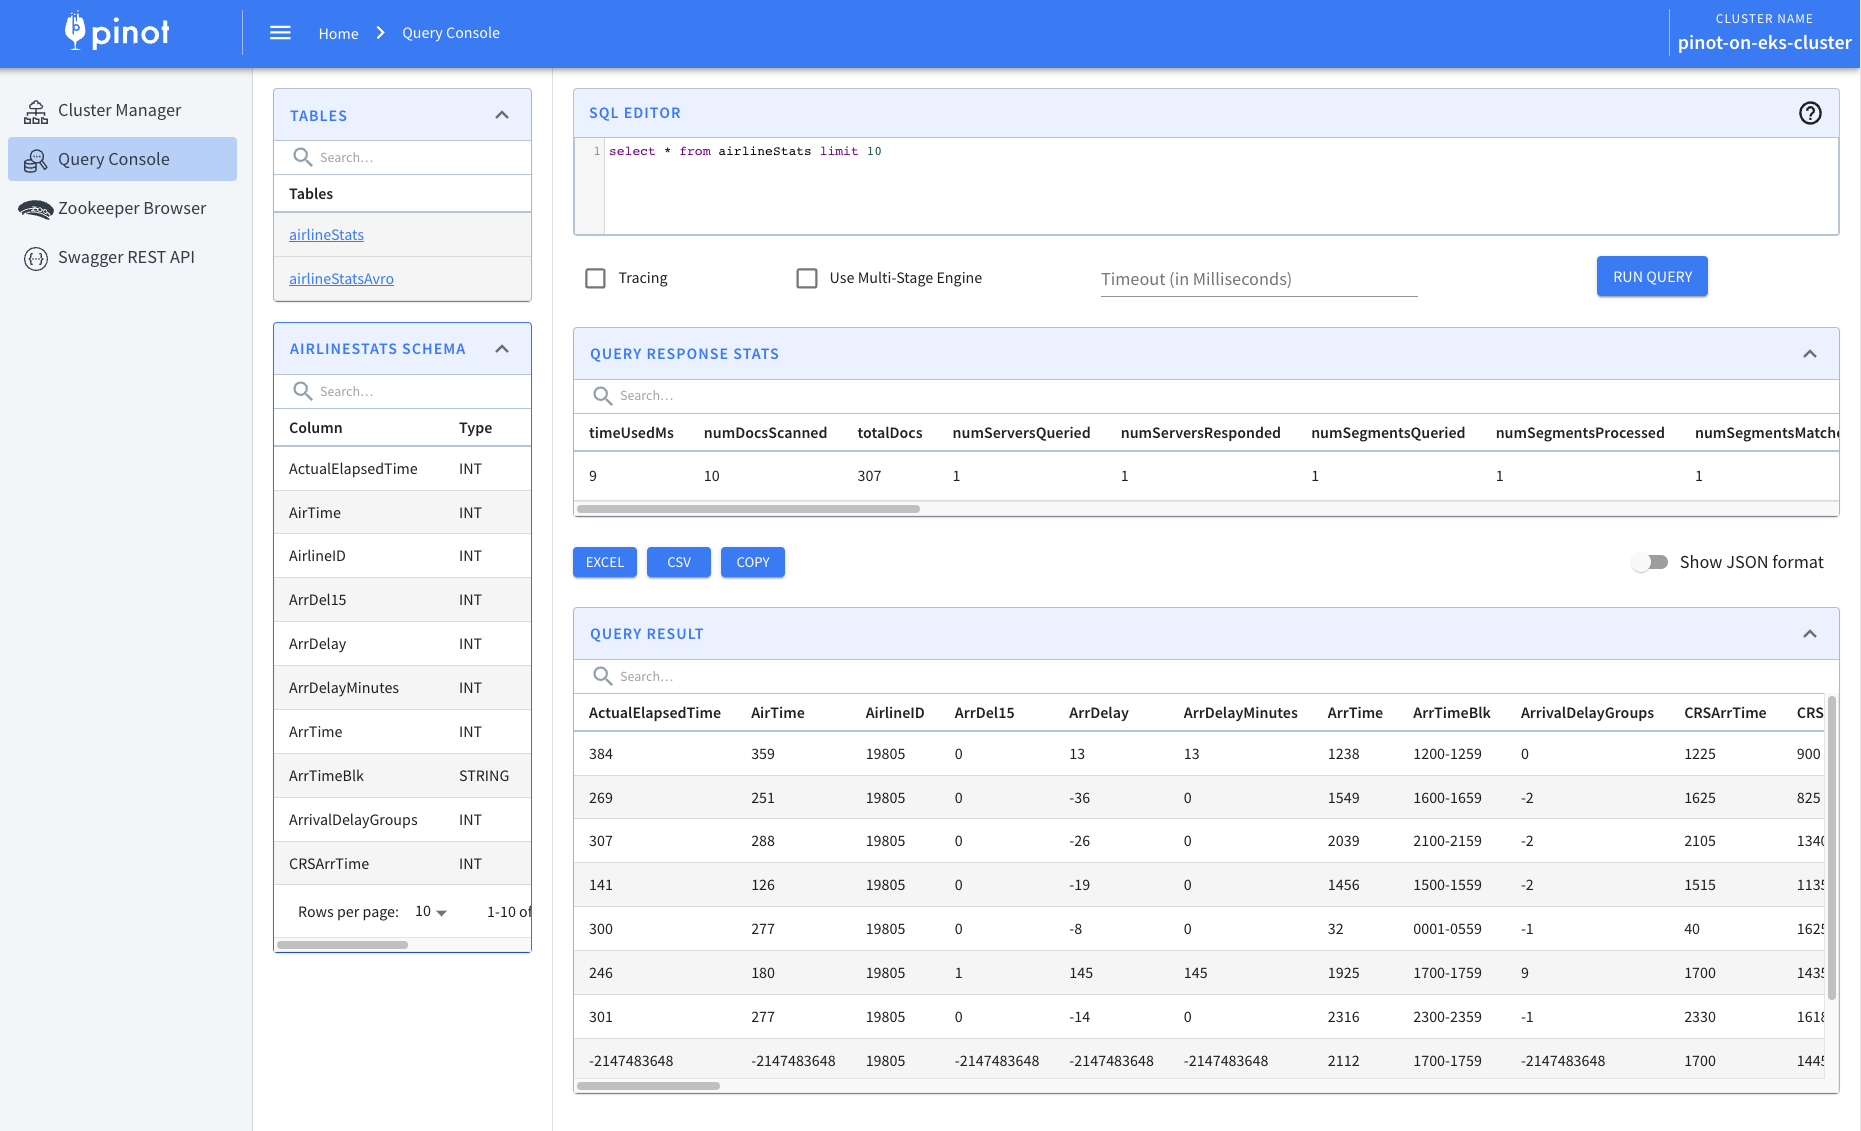
Now lets access Apache Pinot Console using the below command. Console consist of Cluster Manager, Query Explorer, Zookeeper Browser and Swagger REST API Explorer.
kubectl port-forward service/pinot-controller 9000:9000 -n pinot
This will allow you to access Apache Pinot Console like the one shown below using http://localhost:9000
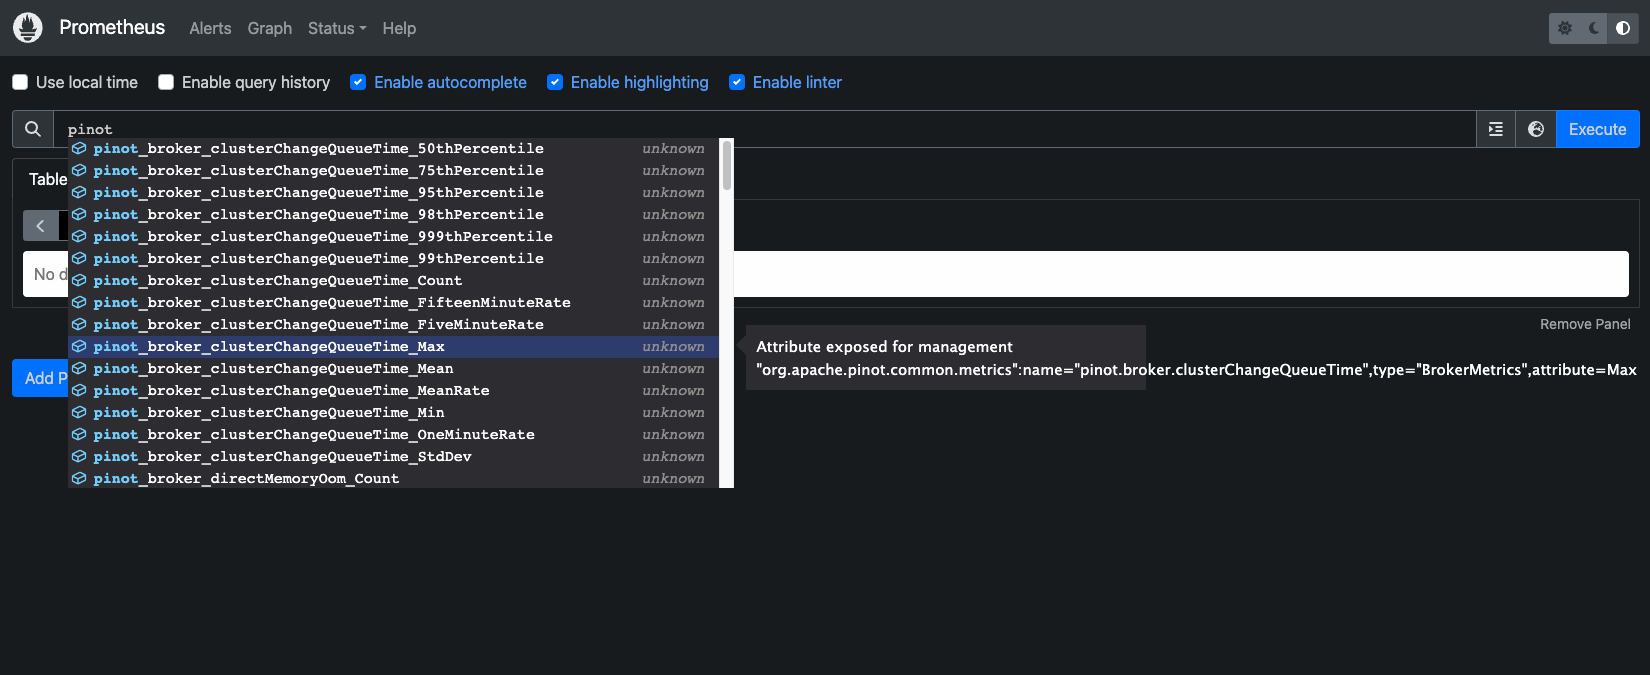
Apache Pinot supports exporting metrics using Prometheus JMX exporter that is packaged within the Apache Pinot docker image. Lets ensure metrics from all Apache Pinot components are getting published to prometheus.
kubectl port-forward service/prometheus-kube-prometheus-prometheus 9090:9090 -n monitoring
Navigate to the prometheus UI at http://localhost:9090, type pinot in the search box and you should be able to see all the metrics.
Next, Let's use Grafana to visualize the Apache Pinot metrics. In order to access Grafana, we need to get the grafana password from AWS Secrets Manager.
aws secretsmanager get-secret-value --secret-id pinot-on-eks-grafana | jq '.SecretString' --raw-output
Now use the port-forwarding to access Grafana at port 8080
kubectl port-forward service/prometheus-grafana 8080:80 -n monitoring
Login to grafana dashboard using admin and password retrieved in the previous step and then navigate to Dashboard and click New and then Import. Use the file pinot.json under data-on-eks/distributed-database/pinot/dashboard to create a pinot dashboard.
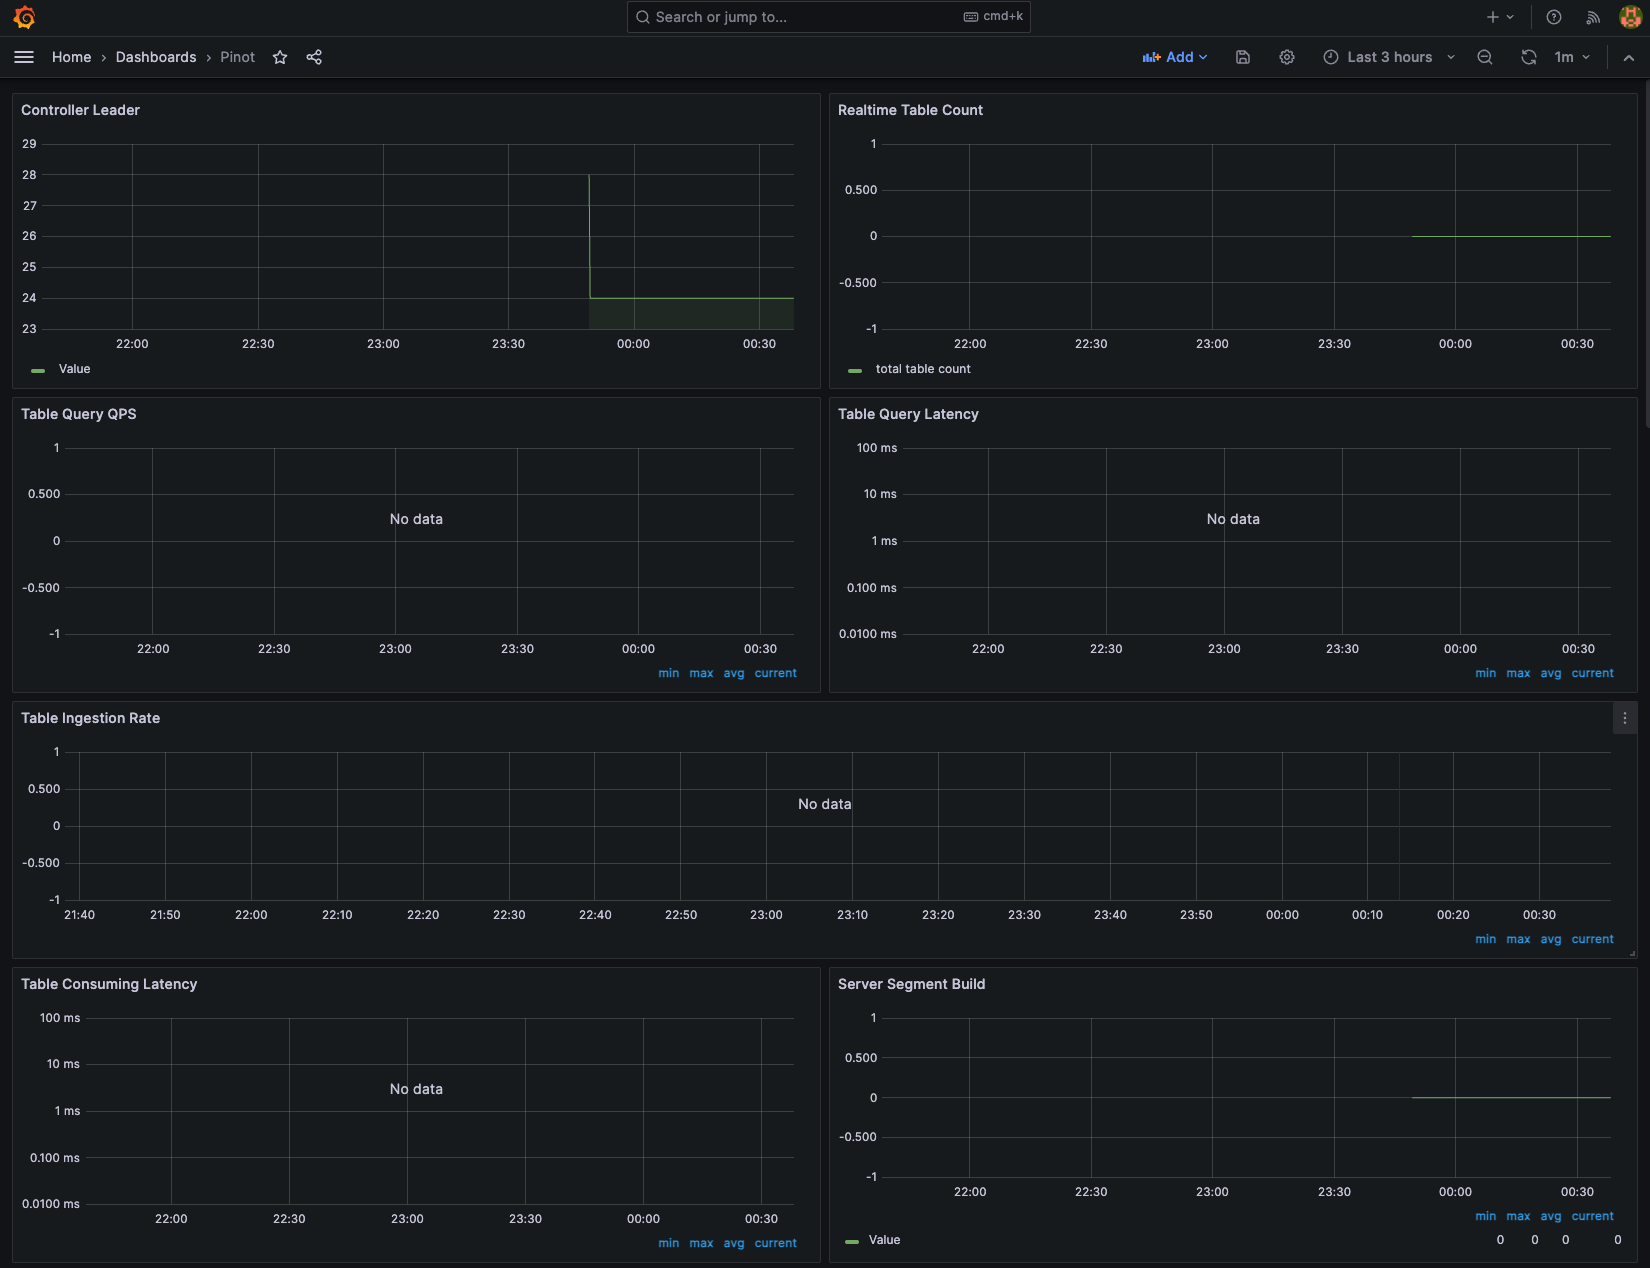
To learn more about the monitoring of Apache Pinot using Prometheus and Grafana use the official guide.
Additional Deployment (Optional) 🏆
Deploy Apache Kafka for Streaming Data
Apache Pinot can ingest data from streaming data sources (real-time) as well as batch data sources (offline). In this example, we will leverage Apache Kafka to push real-time data to a topic.
If you already have Apache Kafka running in your EKS cluster or you are leveraging Amazon Managed Streaming for Apache Kafka (MSK) you can skip this step. Otherwise, follow the steps below to install Kafka in your EKS cluster.
Note: Following deployment configure Kafka Brokers with PLAINTEXT listeners for simplified deployment. Modify the
kafka-values.yamlfile for production deployment
helm repo add bitnami https://charts.bitnami.com/bitnami
helm install -n pinot pinot-kafka bitnami/kafka --values ./helm/kafka-values.yaml
Output
NAME: pinot-kafka
LAST DEPLOYED: Tue Oct 24 01:10:25 2023
NAMESPACE: pinot
STATUS: deployed
REVISION: 1
TEST SUITE: None
NOTES:
CHART NAME: kafka
CHART VERSION: 26.2.0
APP VERSION: 3.6.0

** Please be patient while the chart is being deployed **

Kafka can be accessed by consumers via port 9092 on the following DNS name from within your cluster:

    pinot-kafka.pinot.svc.cluster.local

Each Kafka broker can be accessed by producers via port 9092 on the following DNS name(s) from within your cluster:

    pinot-kafka-controller-0.pinot-kafka-controller-headless.pinot.svc.cluster.local:9092
    pinot-kafka-controller-1.pinot-kafka-controller-headless.pinot.svc.cluster.local:9092
    pinot-kafka-controller-2.pinot-kafka-controller-headless.pinot.svc.cluster.local:9092

To create a pod that you can use as a Kafka client run the following commands:

    kubectl run pinot-kafka-client --restart='Never' --image docker.io/bitnami/kafka:3.6.0-debian-11-r0 --namespace pinot --command -- sleep infinity
    kubectl exec --tty -i pinot-kafka-client --namespace pinot -- bash

    PRODUCER:
        kafka-console-producer.sh \
            --broker-list pinot-kafka-controller-0.pinot-kafka-controller-headless.pinot.svc.cluster.local:9092,pinot-kafka-controller-1.pinot-kafka-controller-headless.pinot.svc.cluster.local:9092,pinot-kafka-controller-2.pinot-kafka-controller-headless.pinot.svc.cluster.local:9092 \
            --topic test

    CONSUMER:
        kafka-console-consumer.sh \
            --bootstrap-server pinot-kafka.pinot.svc.cluster.local:9092 \
            --topic test \
            --from-beginning
Use the command mentioned above to create Kafka Client pod within your namespace.
kubectl run pinot-kafka-client --restart='Never' --image docker.io/bitnami/kafka:3.6.0-debian-11-r0 --namespace pinot --command -- sleep infinity
and then attach to the container shell
kubectl exec --tty -i pinot-kafka-client --namespace pinot -- bash
Create Kafka topics using the below commands, which will then be used to publish messages.
kafka-topics.sh --bootstrap-server pinot-kafka-controller-0.pinot-kafka-controller-headless.pinot.svc.cluster.local:9092 --topic flights-realtime --create --partitions 1 --replication-factor 1

kafka-topics.sh --bootstrap-server pinot-kafka-controller-0.pinot-kafka-controller-headless.pinot.svc.cluster.local:9092 --topic flights-realtime-avro --create --partitions 1 --replication-factor 1
and then exit from the container shell
exit
Use provided example/pinot-realtime-quickstart.yml to create tables and publish sample data to the above topics, which will then get ingested into tables.
kubectl apply -f example/pinot-realtime-quickstart.yml
Now, let's navigate back to Query Console and then click one of the tables. You should be able to see the newly created tables and data coming into tables.
kubectl port-forward service/pinot-controller 9000:9000 -n pinot
Cleanup 🧹
To delete all the components provisioned as part of this blueprint, using the following command to destroy all the resources.
./cleanup.sh
To avoid unwanted charges to your AWS account, delete all the AWS resources created during this deployment
ex. Delete kafka-on-eks EBS volumes