superset
Visualizing Data with Superset and Trino
Introduction
This guide demonstrates how to use Apache Superset with Trino to query and visualize data stored in Amazon S3. In this walkthrough, you will connect Superset to a Trino database, create a new table from data in an S3 bucket, enrich the data with calculated columns, and build interactive charts and dashboards.
Superset is deployed in the same EKS cluster as Trino, and Trino is configured to use Pod Identity to securely access data in S3.
Prerequisites
- Deploy Superset on EKS infrastructure: Infrastructure Setup
- The following tools are installed on your local machine:
kubectlaws-cliwget
Obtain and upload example data
in this example, we use taxi data from nyc
setup env:
export SUPERSET_DIR=$(git rev-parse --show-toplevel)/data-stacks/superset-on-eks
export S3_BUCKET=$(terraform -chdir=$SUPERSET_DIR/terraform/_local output -raw s3_bucket_id_spark_history_server)
get data:
wget https://d37ci6vzurychx.cloudfront.net/trip-data/yellow_tripdata_2025-01.parquet
copy data:
aws s3 cp yellow_tripdata_2025-01.parquet s3://${S3_BUCKET}/example-data/
Login to Superset Configuration
Login to the UI
kubectl port-forward svc/superset 8088:8088 -n superset
Log in with:
- username:
admin - password:
admin
Setup database connection
Apache Superset connects to data from any SQL-speaking datastore or data engine. For this guide, we will connect to Trino, a distributed SQL query engine designed to query large data sets distributed over one or more heterogeneous data sources.
First, let's establish the connection to the Trino database running in our EKS cluster.
-
In the Superset UI, go to Settings -> Database Connections.
-
Click the + Database button in the top right.
-
Select Trino from the dropdown menu of supported databases.
-
Enter the following SQLAlchemy URI:
trino://superset@trino.trino.svc.cluster.local:8080/hive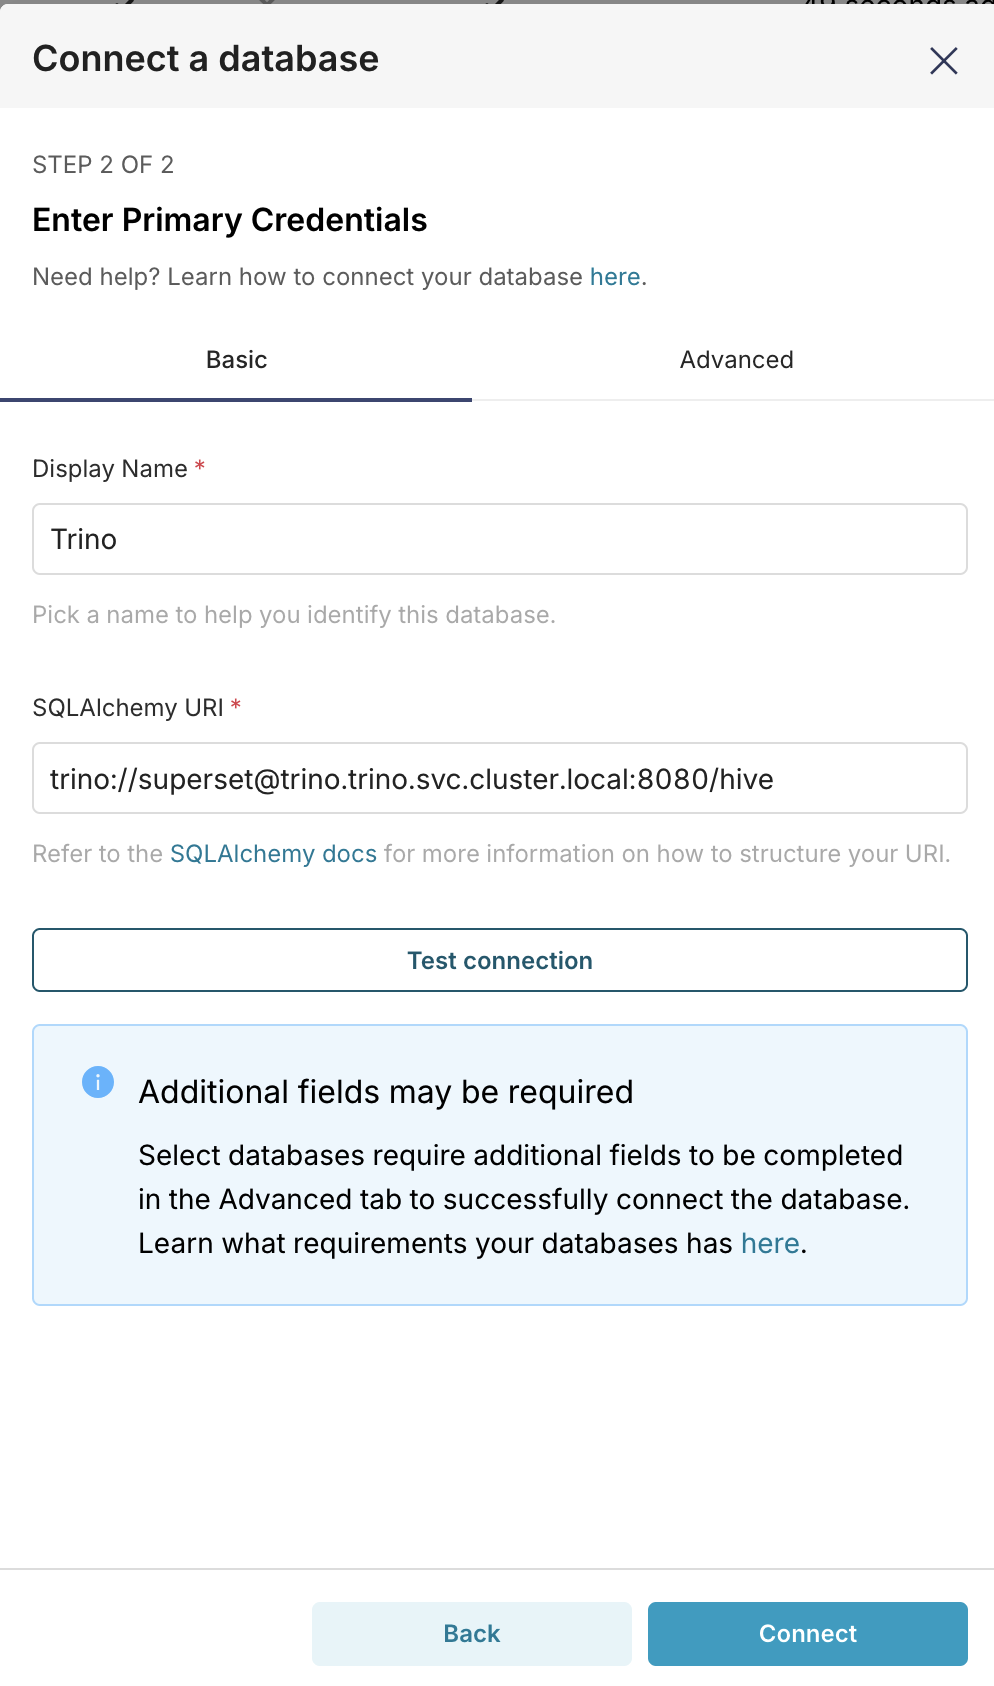
-
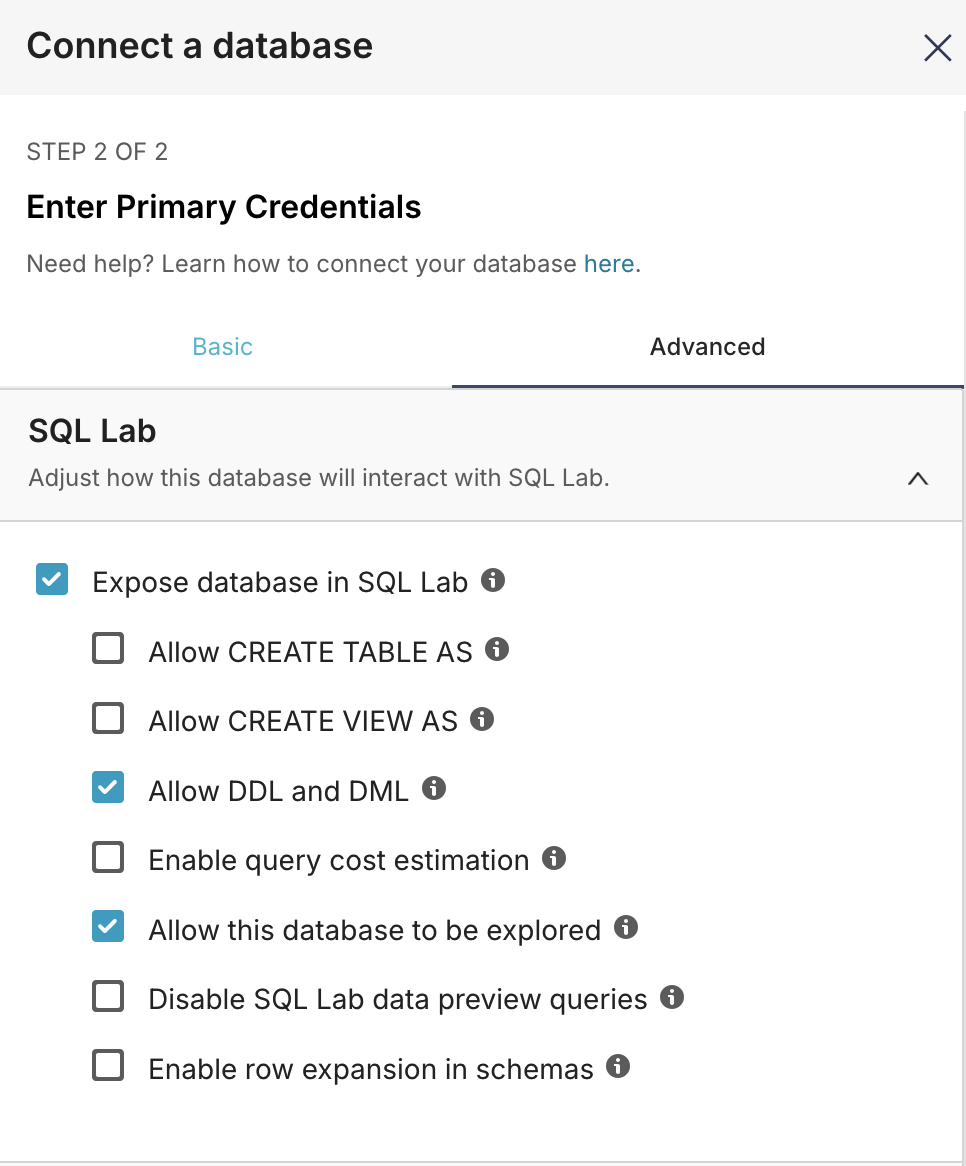
Go to the Advanced tab.
-
Check the box for Allow DDL and DML.
-
Click Finish.
Create the ny_taxi Table
Before creating our table, let's verify that Superset can connect to Trino and see the available schemas.
-
In Superset, navigate to SQL -> SQL Lab.
-
Ensure your Trino database is selected.
-
Run the following query to see available schemas:
SHOW SCHEMAS FROM hive;This should return
data_on_eksas one of the available schemas.
Now, let's create an external table in Trino that points to our S3 data.
-
In the SQL Editor, execute the following
CREATE TABLEstatement.infoBe sure to replace
${YOUR_BUCKET_NAME}in theexternal_locationparameter with the S3 bucket name you exported earlier. You can find it by runningecho $S3_BUCKET.CREATE TABLE hive.data_on_eks.ny_taxi (
VendorID INTEGER,
tpep_pickup_datetime TIMESTAMP,
tpep_dropoff_datetime TIMESTAMP,
passenger_count BIGINT,
trip_distance DOUBLE,
RatecodeID BIGINT,
store_and_fwd_flag VARCHAR,
PULocationID INTEGER,
DOLocationID INTEGER,
payment_type BIGINT,
fare_amount DOUBLE,
extra DOUBLE,
mta_tax DOUBLE,
tip_amount DOUBLE,
tolls_amount DOUBLE,
improvement_surcharge DOUBLE,
total_amount DOUBLE,
congestion_surcharge DOUBLE,
Airport_fee DOUBLE,
cbd_congestion_fee DOUBLE
)
WITH (
format = 'PARQUET',
external_location = 's3://${YOUR_BUCKET_NAME}/example-data/'
); -
Once the table is created, verify that you can read data from it by running:
SELECT * FROM hive.data_on_eks.ny_taxi;
Create a dataset
In Superset, a dataset is a virtual representation of a table or view that you can query. Datasets serve as the foundation for creating charts and dashboards. They allow you to define custom dimensions and metrics, which enriches the data without altering the underlying database table.
Let's create a dataset from our new ny_taxi table.
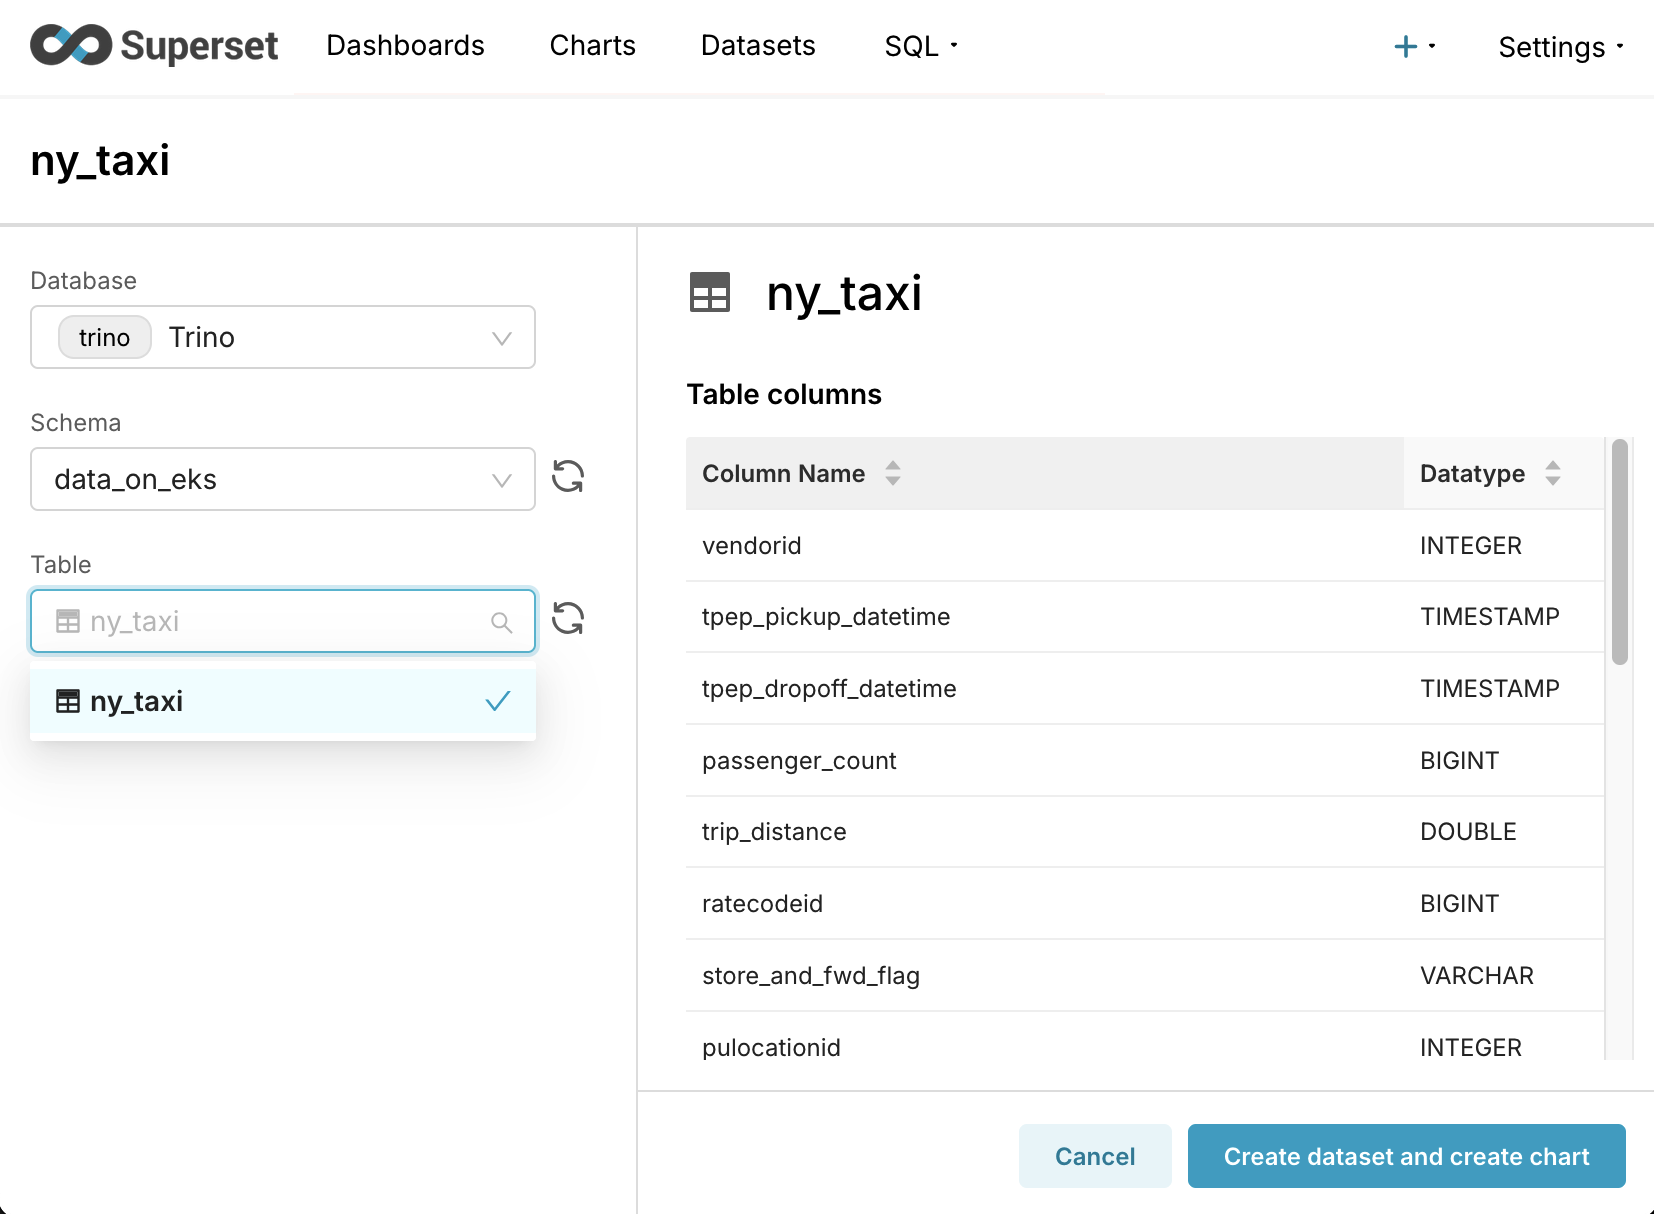
- Navigate to the Datasets tab and click + Dataset.
- Select your Trino database (
trino). - Select the
data_on_eksschema. - Select the
ny_taxitable. - Click Create dataset and create chart.
To make our data easier to analyze, we can create custom calculated columns and metrics.
- Calculated Columns let you create new columns by applying SQL functions to existing ones (e.g., extracting the day of the week from a timestamp).
- Metrics are custom SQL aggregations (e.g.,
AVG(total_amount)) that you can use in your charts.
This allows you to enrich your dataset for visualization without needing to run ALTER TABLE commands in the database.
Let's add a metric for the average trip cost and calculated columns for the hour and day of the week.
- Go to the Datasets tab, find the
ny_taxidataset, and click the Edit icon. - Select the Metrics tab and click + Add item.
- Configure the new metric with the following details:
- Metric:
avg_total_amount - SQL Expression:
AVG(total_amount) - Description:
Average total fare amount per trip - D3 Format:
$,.2f
- Metric:
- Now, select the Calculated Columns tab and click + Add item.
- Create the
day_of_weekcolumn:- Column Name:
day_of_week - SQL Expression:
date_format(tpep_pickup_datetime, '%W')
- Column Name:
- Click + Add item again to create the
hour_of_daycolumn:- Column Name:
hour_of_day - SQL Expression:
hour(tpep_pickup_datetime)
- Column Name:
- Click Save to apply the changes to the dataset.
Create charts
Now that our dataset is enriched, let's create a few charts to explore the taxi trip data.
Chart 1: Heatmap of Trips by Day of Week and Hour
This chart will help us answer the question: "What are the absolute busiest hours of the week for taxi rides?"
- Navigate to the Charts tab and click + Chart.
- Select the
ny_taxidataset. - Choose the Heatmap chart type.
- Set the X-Axis to
hour_of_day. - Set the Y-Axis to
day_of_week. - Set the Metric to
COUNT(*). - Click Create new chart.
- Give your chart a name (e.g., "Heatmap of Trips by Day of Week and Hour") and save it.
Chart 2: Average Trip Fare by Hour of the Day
This chart can show if trips at certain times are more lucrative, helping to answer: "Are trips taken late at night more expensive on average than midday trips?"
- Create another new chart using the
ny_taxidataset. - Choose the Line Chart or Bar Chart type.
- Set the Dimension / X-Axis to
hour_of_day. - Set the Metric to the
avg_total_amountmetric you created earlier. - Click Create new chart.
- Give your chart a name (e.g., "Average Trip Fare by Hour") and save it.
Create dashboard
Finally, let's combine our charts into a single dashboard.
- Navigate to the Dashboards tab and click + Dashboard.
- Give your new dashboard a name, like "NYC Taxi Insights".
- You will be taken to the dashboard editor. Drag the two charts you created from the "Charts" panel on the right onto the dashboard canvas.
- Resize and arrange the charts as you see fit.
- Click Save.
You now have an interactive dashboard for exploring the taxi data. Feel free to create more charts and add them to your dashboard to continue your analysis.
Clean up
To avoid unwanted charges to your AWS account, it is important to delete all the AWS resources created during this deployment.
The cleanup.sh script in the data-stacks/superset-on-eks directory will destroy all the resources that were created.
cd $(git rev-parse --show-toplevel)/data-stacks/superset-on-eks
./cleanup.sh
This command will permanently delete the EKS cluster and all associated resources.