Spark Observability on EKS
Overview
This example demonstrates production-grade observability for Apache Spark on EKS using native Spark metrics exporters, Prometheus for time-series data collection, Grafana for visualization, and Spark History Server for post-execution analysis.
Key Components:
- Spark UI: Real-time application monitoring (active jobs only)
- Spark History Server: Historical job analysis and event log replay
- PrometheusServlet: Native Spark metrics exporter to Prometheus
- Kube-Prometheus-Stack: Metrics aggregation, storage, and alerting
- Grafana: Customizable dashboards for operational insights
Prerequisites
Before proceeding, ensure you have deployed the Spark on EKS infrastructure following the Infrastructure Setup Guide.
Required Components (deployed by default):
- ✅ Spark on EKS infrastructure with
enable_spark_history_server = true - ✅ Kube-Prometheus-Stack (Prometheus + Grafana + AlertManager)
- ✅ S3 bucket for Spark event logs
- ✅
kubectlconfigured for cluster access
Spark Metrics Architecture
PrometheusServlet Sink
Apache Spark natively supports exporting metrics via the PrometheusServlet sink, an HTTP endpoint that exposes metrics in Prometheus format. This eliminates the need for external agents or sidecars.
How it works:
- Spark exposes
/metrics/driver/prometheus/and/metrics/executors/prometheus/endpoints - Prometheus scrapes these endpoints via Kubernetes pod annotations
- Metrics are stored in Prometheus time-series database
- Grafana queries Prometheus for visualization
Metrics Configuration
Add these configurations to your SparkApplication YAML to enable metrics export:
sparkConf:
  # Enable Prometheus metrics endpoint
  "spark.ui.prometheus.enabled": "true"
  "spark.executor.processTreeMetrics.enabled": "true"

  # PrometheusServlet sink configuration
  "spark.metrics.conf.*.sink.prometheusServlet.class": "org.apache.spark.metrics.sink.PrometheusServlet"
  "spark.metrics.conf.driver.sink.prometheusServlet.path": "/metrics/driver/prometheus/"
  "spark.metrics.conf.executor.sink.prometheusServlet.path": "/metrics/executors/prometheus/"
Key Configuration Parameters:
spark.ui.prometheus.enabled: Enables/metrics/prometheusendpoint on Spark UIspark.executor.processTreeMetrics.enabled: Collects process-level CPU/memory metricsprometheusServlet.class: Configures native Prometheus sinkprometheusServlet.path: Defines HTTP endpoint path for metrics
Event Log Configuration
Spark History Server requires event logs stored in S3:
sparkConf:
  # Event logging for History Server
  "spark.eventLog.enabled": "true"
  "spark.eventLog.dir": "s3a://<S3_BUCKET>/spark-event-logs"
  "spark.eventLog.rolling.enabled": "true"
  "spark.eventLog.rolling.maxFileSize": "64m"

  # S3 access with Pod Identity (AWS SDK V2)
  "spark.hadoop.fs.s3a.aws.credentials.provider.mapping": "com.amazonaws.auth.WebIdentityTokenCredentialsProvider=software.amazon.awssdk.auth.credentials.ContainerCredentialsProvider"
  "spark.hadoop.fs.s3a.aws.credentials.provider": "software.amazon.awssdk.auth.credentials.ContainerCredentialsProvider"
  "spark.hadoop.fs.s3.impl": "org.apache.hadoop.fs.s3a.S3AFileSystem"
Important: Use ContainerCredentialsProvider (AWS SDK V2) instead of deprecated InstanceProfileCredentialsProvider for IRSA/Pod Identity authentication.
Hands-On: Deploy and Monitor Spark Jobs
Step 1: Submit Sample Spark Job
Use the reference PySpark job with observability pre-configured:
cd data-stacks/spark-on-eks/examples

# Replace <S3_BUCKET> with your bucket from Terraform outputs
export S3_BUCKET=$(kubectl get cm -n spark-team-a spark-s3-config -o jsonpath='{.data.bucket}' 2>/dev/null || echo "your-s3-bucket-name")

# Update S3 bucket placeholder
sed "s/\$S3_BUCKET/${S3_BUCKET}/g" pyspark-pi-job.yaml | kubectl apply -f -
Available Example Jobs:
pyspark-pi-job.yaml- Simple Pi calculation with metricsspark-app-graviton.yaml- ARM-based Graviton workload- Additional examples in
data-stacks/spark-on-eks/examples/
Step 2: Access Real-Time Spark Web UI
Monitor active jobs via Spark's native Web UI:
# Find running driver pod
kubectl get pods -n spark-team-a -l spark-role=driver

# Port-forward to driver pod
kubectl port-forward -n spark-team-a <driver-pod-name> 4040:4040
Open http://localhost:4040 to view:
- Jobs Tab: DAG visualization and stage execution
- Stages Tab: Task-level metrics (shuffle, I/O, GC)
- Storage Tab: RDD/DataFrame caching statistics
- Environment Tab: Spark configuration and JVM properties
- Executors Tab: Per-executor resource utilization
Limitation: Spark UI terminates with the SparkContext. For post-execution analysis, use Spark History Server.
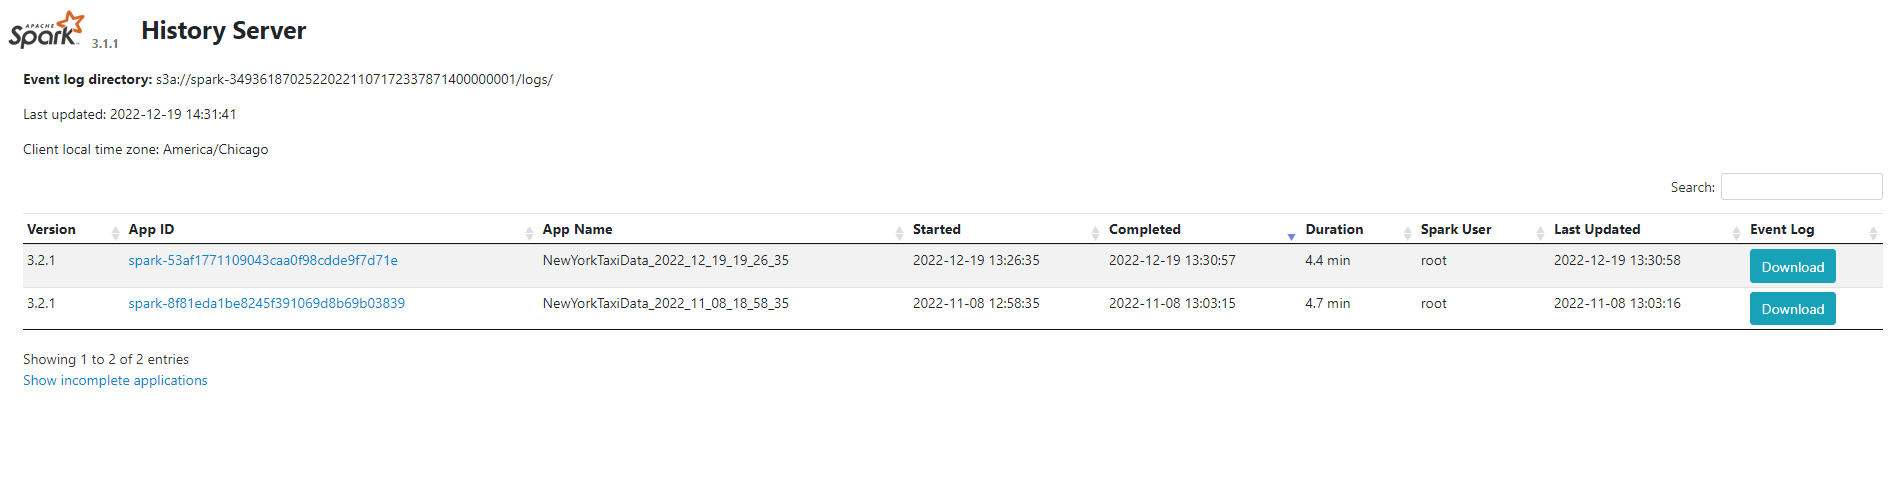
Spark History Server
Spark History Server replays event logs from S3 to provide persistent UI access after jobs complete.
Access History Server
# Port-forward to History Server service
kubectl port-forward -n spark-history-server svc/spark-history-server 18080:80
Open http://localhost:18080 to view:
- All completed Spark applications
- Full job execution timeline and DAG
- Event log replay with same UI as live Spark UI
- Historical resource utilization trends
Event Log Retention: Configure spark.history.fs.cleaner.enabled and spark.history.fs.cleaner.maxAge to manage S3 storage costs.
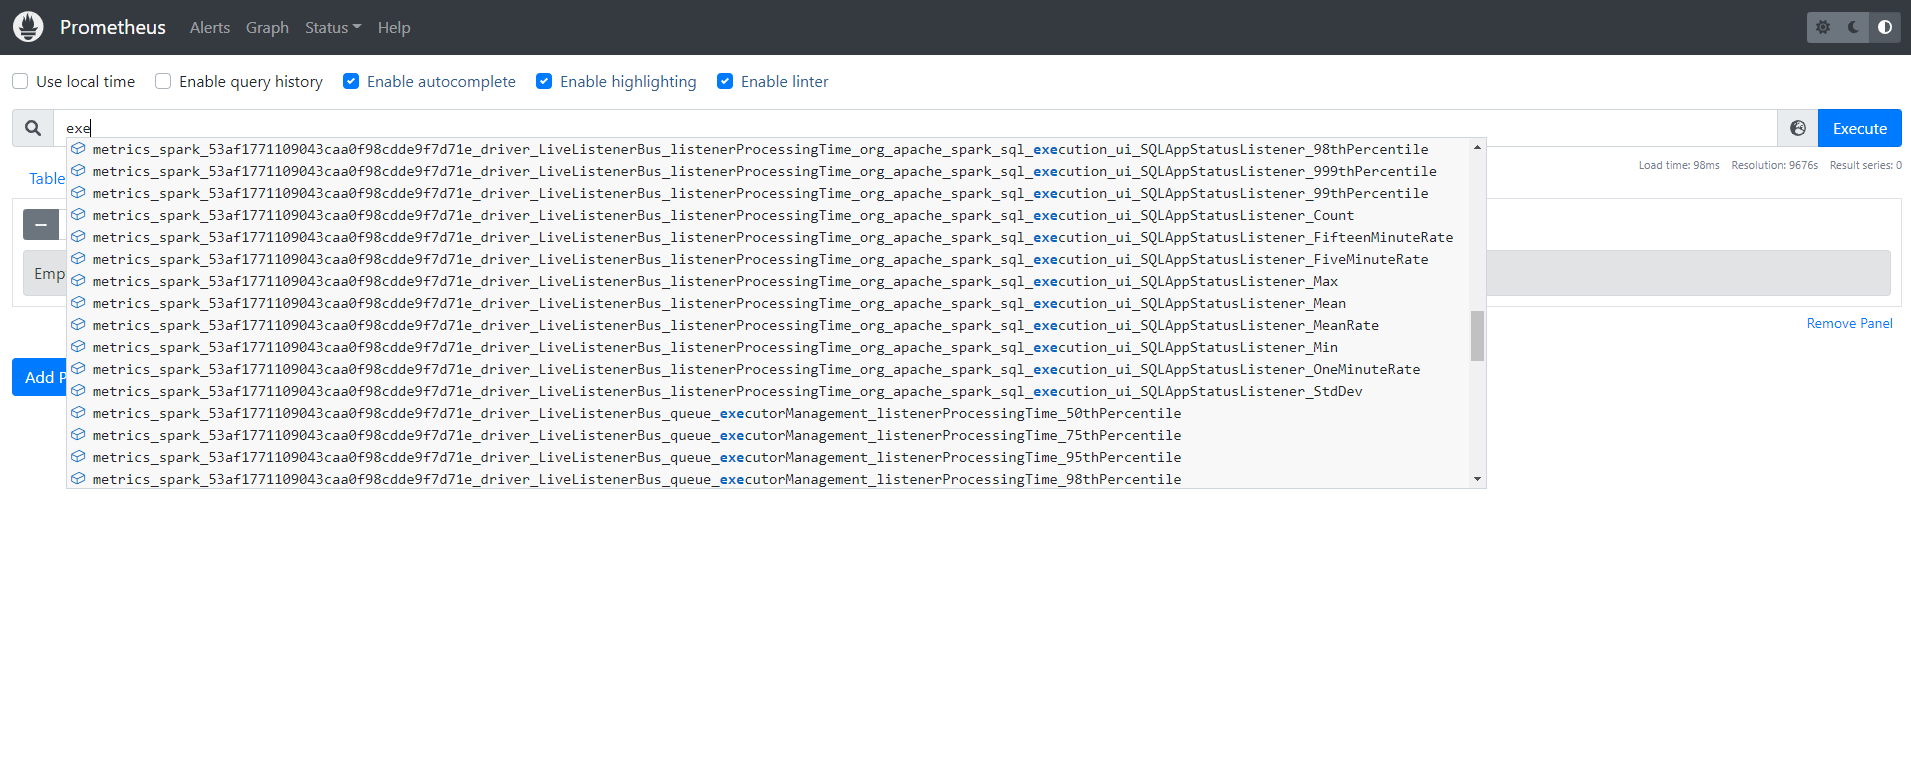
Prometheus Metrics Collection
Verify Prometheus Scraping
Check if Prometheus is successfully scraping Spark metrics:
# Port-forward to Prometheus
kubectl port-forward -n monitoring svc/kube-prometheus-stack-prometheus 9090:9090
Navigate to http://localhost:9090 and query:
# Verify Spark driver metrics
spark_driver_jvm_heap_used{namespace="spark-team-a"}

# Executor task metrics
spark_executor_completedTasks_total

# GC time metrics
rate(spark_driver_jvm_gc_time[5m])
Key Spark Metrics Exported
Driver Metrics:
spark_driver_jvm_heap_used- JVM heap utilizationspark_driver_DAGScheduler_stage_failedStages- Failed stages countspark_driver_BlockManager_memory_memUsed_MB- Block manager memory
Executor Metrics:
spark_executor_completedTasks_total- Completed tasks per executorspark_executor_runtime_jvm_heap_used- Executor JVM heapspark_executor_filesystem_write_bytes- Shuffle/output write volume
Application Metrics:
spark_app_stages- Total stagesspark_app_tasks- Total tasksspark_app_executors- Active executors count
Grafana Dashboards
Access Grafana
# Get Grafana admin password
kubectl get secret -n grafana grafana -o jsonpath="{.data.admin-password}" | base64 -d && echo

# Port-forward to Grafana
kubectl port-forward -n grafana svc/grafana 3000:80
Login: admin / <password-from-secret>
Import Spark Dashboard
Import community dashboard ID: 7890 (Spark Application Monitoring):
- Navigate to Dashboards → Import
- Enter dashboard ID:
7890 - Select Prometheus data source:
Prometheus - Click Import
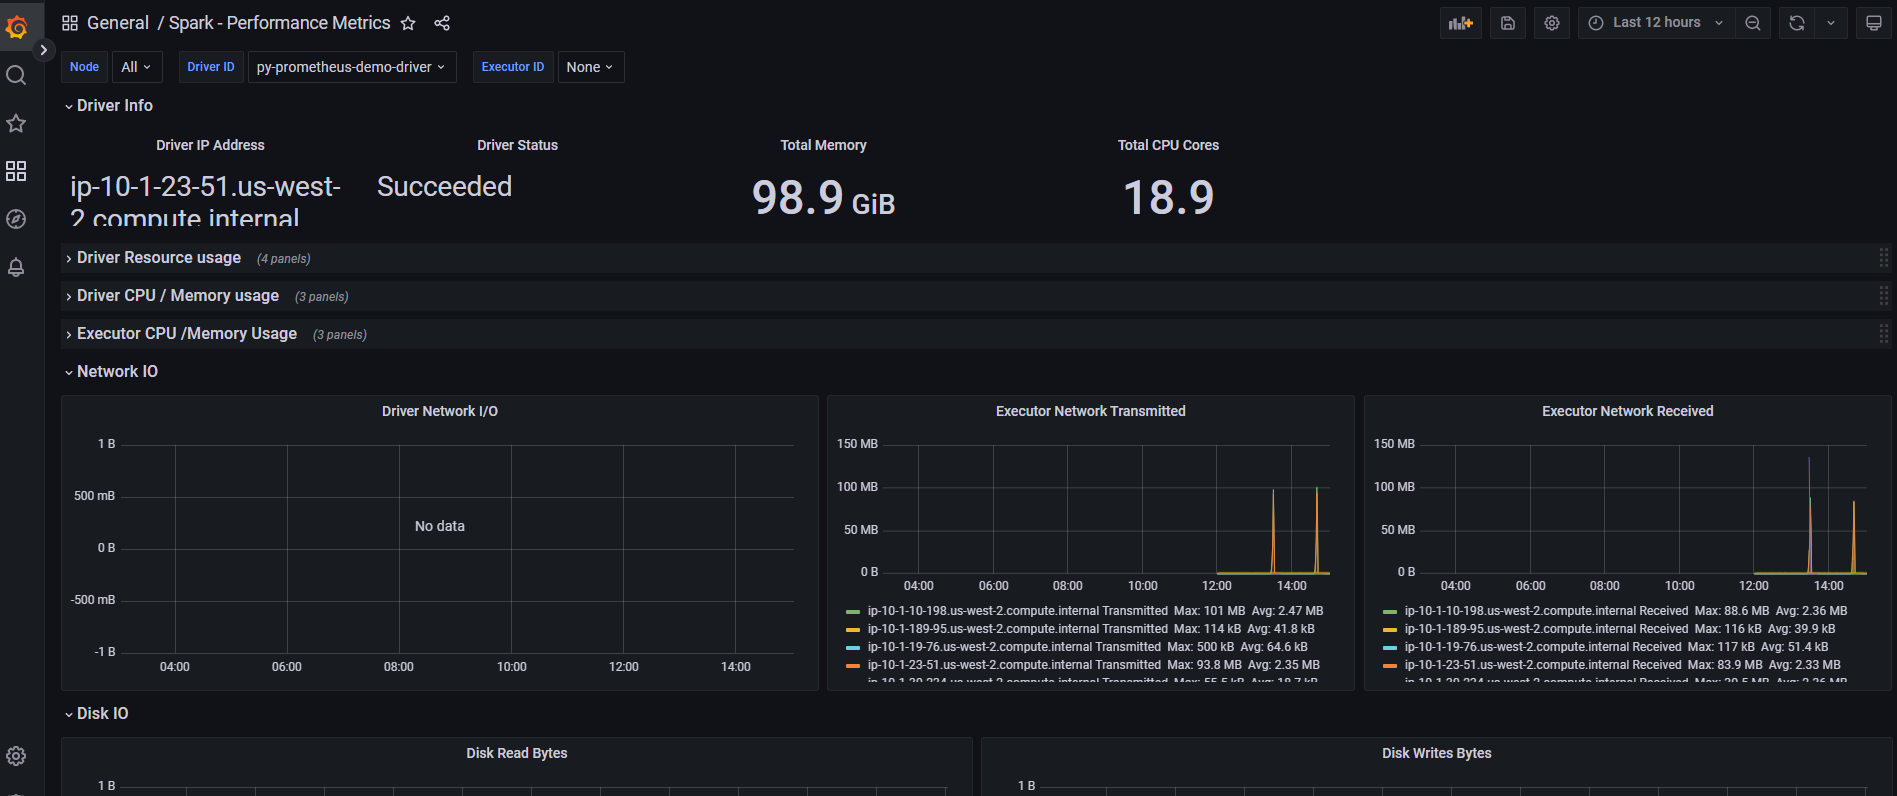
Dashboard Panels:
- Active/completed jobs timeline
- Executor resource utilization (CPU, memory, disk)
- Shuffle read/write performance
- GC overhead and pause times
- Task execution distribution
Custom Metrics Queries
Create custom panels with PromQL:
# Average task execution time per stage
avg(spark_stage_executor_runTime) by (stage_id)

# Shuffle spill to disk (performance bottleneck indicator)
sum(rate(spark_executor_shuffle_write_diskSpill_bytes[5m])) by (pod)

# Driver OOM risk indicator
(spark_driver_jvm_heap_used / spark_driver_jvm_heap_max) * 100 > 85
Production Best Practices
Event Log Optimization
# Rolling event logs to prevent large files
"spark.eventLog.rolling.enabled": "true"
"spark.eventLog.rolling.maxFileSize": "128m"  # Tune based on job size

# Compress event logs for S3 storage savings
"spark.eventLog.compress": "true"
Metrics Cardinality Management
# Limit executor metrics to prevent Prometheus overload
"spark.metrics.executorMetricsSource.enabled": "false"  # Disable if not needed

# Sample metrics collection (reduces overhead)
"spark.metrics.staticSources.enabled": "false"
Alerting Rules
Configure Prometheus AlertManager for critical events:
# Example: Spark job failure alert
- alert: SparkJobFailed
  expr: spark_driver_DAGScheduler_job_allJobs{status="failed"} > 0
  for: 1m
  annotations:
    summary: "Spark job {{ $labels.app_name }} failed"
Troubleshooting
Metrics Not Appearing in Prometheus
Check pod annotations:
kubectl get pods -n spark-team-a <driver-pod> -o yaml | grep -A5 annotations
Expected annotations:
prometheus.io/scrape: "true"
prometheus.io/path: "/metrics/driver/prometheus/"
prometheus.io/port: "4040"
Verify Prometheus targets:
- Navigate to
http://localhost:9090/targets - Search for
spark-team-anamespace - Ensure targets are
UP
History Server Shows No Applications
Check event log permissions:
# Verify IRSA role has S3 read access
kubectl describe sa -n spark-team-a spark-team-a

# Check S3 event log path
aws s3 ls s3://<S3_BUCKET>/spark-event-logs/
High Metrics Cardinality
Reduce executor-level metrics:
# Disable per-executor detailed metrics
"spark.metrics.conf.executor.sink.prometheusServlet.class": ""