Clickstream Analytics with Kafka and Python Streams
This example demonstrates a production-ready event streaming pipeline that processes user clickstream data in real-time using Apache Kafka and Python stream processing (kstreams library) on Amazon EKS.
Use Case
Real-time clickstream analytics is essential for understanding user behavior, optimizing conversion funnels, and personalizing user experiences. This pipeline processes events like page views, clicks, and purchases to generate instant insights.
Real-world applications:
- E-commerce: Track shopping behavior, cart abandonment, purchase patterns
- Media: Measure content engagement, video watch time, scroll depth
- SaaS: Monitor feature usage, user flows, session analytics
- Marketing: Analyze campaign effectiveness, attribution, referrer performance
Architecture
The pipeline implements a classic event streaming pattern with real-time aggregation:
┌──────────┐      ┌───────────────┐      ┌─────────────┐      ┌───────────────┐      ┌──────────┐
│ Producer │ ───> │ Kafka Topic   │ ───> │   Python    │ ───> │ Kafka Topic   │ ───> │ Consumer │
│ (Events) │      │ (Raw Events)  │      │  Streams    │      │ (Metrics)     │      │ (Display)│
└──────────┘      └───────────────┘      │ (kstreams)  │      └───────────────┘      └──────────┘
                   6 partitions            └─────────────┘       3 partitions
                   24h retention           5-min windows         7d retention
Components
| Component | Technology | Purpose | Configuration |
|---|---|---|---|
| Event Producer | Python + kafka-python | Generate realistic clickstream events | 10 events/sec, 100 simulated users |
| Raw Events Topic | Kafka | Store incoming events | 6 partitions, 3 replicas, 24h retention |
| Stream Processor | Python + kstreams | Real-time windowed aggregations | 5-min tumbling windows, async processing |
| Metrics Topic | Kafka | Store aggregated metrics | 3 partitions, 3 replicas, 7d retention |
| Metrics Consumer | Python + kafka-python | Display real-time dashboard | Consumer group with auto-commit |
Data Flow
1. Event Generation
The producer generates realistic clickstream events:
{
  "event_id": "550e8400-e29b-41d4-a716-446655440000",
  "timestamp": "2024-10-26T10:30:45.123Z",
  "user_id": "user_42",
  "session_id": "sess_abc123def456",
  "event_type": "page_view",
  "page_url": "/products/laptop",
  "page_category": "electronics",
  "referrer": "google.com",
  "device_type": "mobile",
  "country": "US",
  "duration_ms": 2500
}
Event types: page_view, click, add_to_cart, purchase, search
Partitioning: By user_id to maintain event ordering per user
Rate: Configurable (default: 10 events/second)
2. Stream Processing
The Python stream processor uses the kstreams library to process events in 5-minute tumbling windows, calculating:
- Volume metrics: Total events, unique users, unique sessions
- Event breakdown: Distribution across event types (views, clicks, purchases)
- Device analytics: Mobile vs desktop vs tablet usage
- Top referrers: Traffic sources (Google, X, Reddit, direct, email)
- Top pages: Most visited URLs
- Engagement: Average page duration
Key features of kstreams:
- Pure Python implementation (no JVM required)
- Asynchronous I/O using asyncio
- Consumer groups for fault-tolerant consumption
- Stateful windowed aggregations
- Easy to understand and debug
3. Metrics Output
Aggregated metrics published every 5 minutes:
{
  "window_start": "2024-10-26T10:30:00Z",
  "window_end": "2024-10-26T10:35:00Z",
  "total_events": 3000,
  "unique_users": 100,
  "unique_sessions": 684,
  "event_types": {
    "page_view": 582,
    "click": 659,
    "add_to_cart": 578,
    "search": 568,
    "purchase": 613
  },
  "devices": {
    "mobile": 1013,
    "desktop": 996,
    "tablet": 991
  },
  "top_referrers": {
    "google.com": 642,
    "x.com": 603,
    "email": 599
  },
  "top_pages": {
    "/products/laptop": 251,
    "/blog": 242,
    "/contact": 240
  },
  "avg_duration_ms": 5162
}
4. Visualization
The consumer displays a real-time dashboard:
================================================================================
📊 CLICKSTREAM METRICS
================================================================================
⏰ Window: 2024-10-26T10:30:00Z → 2024-10-26T10:35:00Z

📈 OVERVIEW:
   Total Events:     3,000
   Unique Users:     100
   Unique Sessions:  684
   Avg Duration:     5,162ms

🔹 EVENT TYPES:
   click              659 ( 22.0%)
   purchase           613 ( 20.4%)
   page_view          582 ( 19.4%)
   add_to_cart        578 ( 19.3%)
   search             568 ( 18.9%)

📱 DEVICES:
   mobile           1,013 ( 33.8%)
   desktop            996 ( 33.2%)
   tablet             991 ( 33.0%)

🔗 TOP REFERRERS:
   google.com            642 ( 21.4%)
   x.com                 603 ( 20.1%)
   email                 599 ( 20.0%)

📄 TOP PAGES:
   /products/laptop      251 (  8.4%)
   /blog                 242 (  8.1%)
   /contact              240 (  8.0%)
================================================================================
Deployment
Prerequisites
Before deploying the pipeline:
- Kafka on EKS deployed - Complete the infrastructure deployment
- kubectl configured - Connected to your EKS cluster
- Kafka cluster healthy - All brokers running
# Verify Kafka cluster
kubectl get kafka -n kafka
# Expected: data-on-eks with READY=True

# Check Kafka pods
kubectl get pods -n kafka | grep data-on-eks
# Expected: All brokers and controllers Running
Deploy the Pipeline
Navigate to the example directory and run the setup script:
cd data-stacks/kafka-on-eks/examples/pipeline
./setup.sh
The script performs the following:
-
Creates Kafka topics:
clickstream-events: Raw event storage (6 partitions, 24h retention)clickstream-metrics: Aggregated metrics (3 partitions, 7d retention)
-
Deploys pipeline components:
- Producer: Generates clickstream events
- Stream Processor: Python application using kstreams library
- Consumer: Displays aggregated metrics
Deployment time: ~2-3 minutes
Verify Deployment
Check all components are running:
# Check pods
kubectl get pods -n kafka | grep clickstream

# Expected output:
# clickstream-producer-xxx             1/1     Running
# clickstream-streams-processor-xxx    1/1     Running
# clickstream-consumer-xxx             1/1     Running
Monitoring the Pipeline
View Real-Time Metrics
Watch the consumer output to see aggregated metrics (wait 5-6 minutes for first window):
kubectl logs -f deployment/clickstream-consumer -n kafka
You should see metrics updated every 5 minutes as new windows complete.
Monitor Producer
Check event generation:
kubectl logs -f deployment/clickstream-producer -n kafka
Expected output:
✓ Connected to Kafka: ['data-on-eks-kafka-bootstrap:9092']
🚀 Generating 10 events/second

📊 Sent 50 events | Rate: 10.2 events/sec | Partition: 3 | Offset: 1234
📊 Sent 100 events | Rate: 10.1 events/sec | Partition: 1 | Offset: 5678
Monitor Stream Processing
Check stream processor status:
kubectl logs -f deployment/clickstream-streams-processor -n kafka
Expected output:
🚀 Starting Clickstream Analytics Processor
📥 Source: clickstream-events
📤 Sink: clickstream-metrics
⏱️  Window Size: 5 minutes

✅ Window completed: 2024-10-26T10:30:00 → 2024-10-26T10:35:00
   Events processed: 3000
   Unique users: 100
Kafka Topic Metrics
Inspect topic activity:
# Create kafka-cli pod if not exists
kubectl run kafka-cli --image=confluentinc/cp-kafka:7.5.0 \
  --restart=Never -n kafka -- sleep infinity

# View raw events
kubectl exec -it kafka-cli -n kafka -- kafka-console-consumer.sh \
  --bootstrap-server data-on-eks-kafka-bootstrap:9092 \
  --topic clickstream-events \
  --max-messages 5

# View aggregated metrics
kubectl exec -it kafka-cli -n kafka -- kafka-console-consumer.sh \
  --bootstrap-server data-on-eks-kafka-bootstrap:9092 \
  --topic clickstream-metrics \
  --from-beginning
Monitor with Grafana
Access Grafana to monitor pipeline metrics (see Infrastructure Guide for setup):
kubectl port-forward -n monitoring svc/kube-prometheus-stack-grafana 3000:80
Open http://localhost:3000 and import the custom dashboard from monitoring/grafana-dashboard.json.
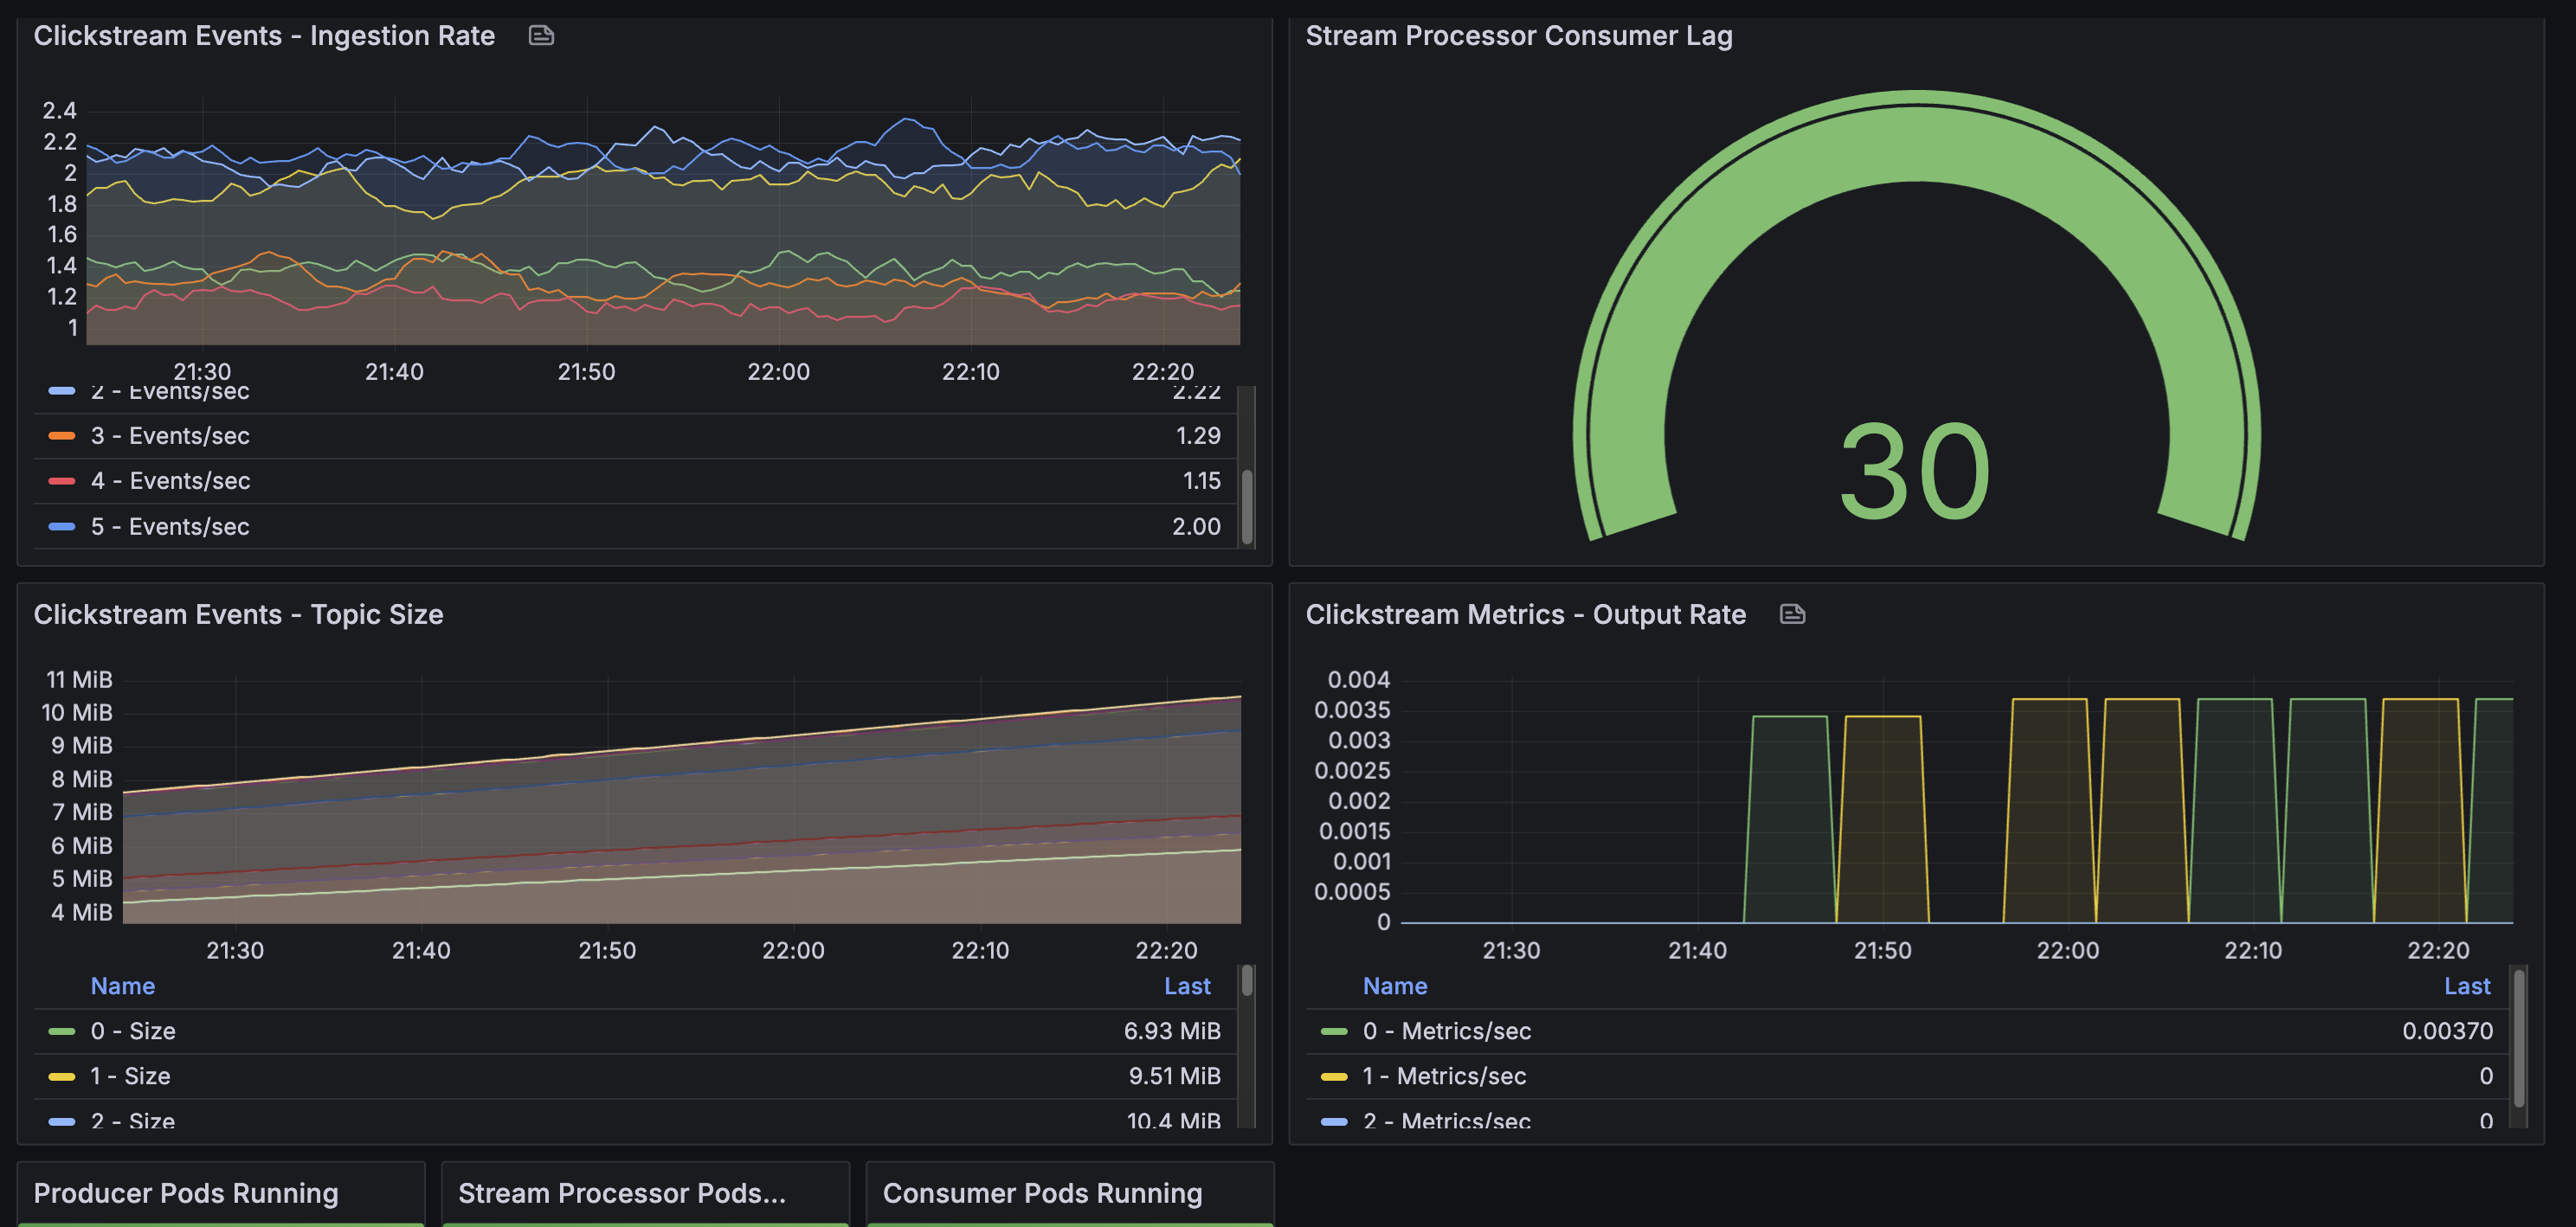
Key Metrics to Monitor:
- Consumer lag (
clickstream-processorgroup): Should stay below 100 messages- Measures how far behind the stream processor is from the latest message
- Lag = 0: Perfectly caught up, processing in real-time
- Lag > 100: Stream processor falling behind, investigate performance
- Topic throughput:
clickstream-events: ~10 messages/sec ingestion rateclickstream-metrics: 1 message every 5 minutes (window output)
- Pod health: All 3 pipeline pods (producer, processor, consumer) should be Running
- Partition balance: Events distributed across all 6 partitions
Customization
Adjust Event Rate
To increase or decrease event generation, edit the producer deployment:
# deploy/producer-deployment.yaml
producer.run(events_per_second=50)  # Change from default 10
Apply changes:
kubectl apply -f deploy/producer-deployment.yaml
kubectl rollout restart deployment/clickstream-producer -n kafka
Change Window Size
To modify aggregation windows, edit the stream processor:
# deploy/streams-deployment-python.yaml (in ConfigMap)
WINDOW_SIZE_MINUTES = 1  # Change from default 5
Apply and restart:
kubectl apply -f deploy/streams-deployment-python.yaml
kubectl rollout restart deployment/clickstream-streams-processor -n kafka
Scale Stream Processing
Increase replicas for higher throughput:
# Scale stream processor (max = number of partitions)
kubectl scale deployment clickstream-streams-processor -n kafka --replicas=3
Note: Maximum replicas equals the number of partitions (6 for clickstream-events topic). Each replica processes events from assigned partitions.
Troubleshooting
Producer Not Sending Events
# Check producer logs for errors
kubectl logs deployment/clickstream-producer -n kafka

# Verify Kafka connectivity from producer pod
kubectl exec deployment/clickstream-producer -n kafka -- \
  python -c "from kafka import KafkaProducer; \
  p = KafkaProducer(bootstrap_servers=['data-on-eks-kafka-bootstrap:9092']); \
  print('Connected successfully')"
Stream Processor Not Processing
# Check processor logs
kubectl logs deployment/clickstream-streams-processor -n kafka

# Check if it's consuming events
kubectl get pods -n kafka | grep clickstream-streams-processor
# Should show: Running (not CrashLoopBackOff or Completed)
Common issues:
- Pod keeps restarting: Check logs for Python errors or Kafka connection issues
- No window completion messages: Wait 5-6 minutes for first window to complete
- Connection errors: Verify Kafka bootstrap server address
Consumer Not Receiving Metrics
# Verify metrics are being written
kubectl exec kafka-cli -n kafka -- kafka-console-consumer.sh \
  --bootstrap-server data-on-eks-kafka-bootstrap:9092 \
  --topic clickstream-metrics \
  --from-beginning

# Check consumer logs
kubectl logs deployment/clickstream-consumer -n kafka
# Should show: "🚀 Starting metrics consumer... ⏱️ Waiting for metrics"
Important: Consumer uses auto_offset_reset='latest', so it only shows metrics from new windows. Wait 5 minutes for next window to complete.
Topic Issues
# Check topic health
kubectl get kafkatopic -n kafka | grep clickstream

# View topic details
kubectl describe kafkatopic clickstream-events -n kafka
kubectl describe kafkatopic clickstream-metrics -n kafka
Cleanup
To remove all pipeline components:
cd data-stacks/kafka-on-eks/examples/pipeline
./cleanup.sh
This deletes:
- Producer, stream processor, and consumer deployments
- Kafka topics (
clickstream-events,clickstream-metrics)
Key Concepts
Why This Architecture?
Kafka as Event Backbone:
- Decouples producers from consumers
- Provides durable, replicated event storage
- Enables multiple consumers for the same events
- Supports event replay for reprocessing
Python Streams with kstreams:
- Pure Python implementation (no JVM complexity)
- Asynchronous processing using Python asyncio
- Consumer groups for fault tolerance
- Easy to understand, debug, and extend
- Works with standard Python tooling
Separation of Concerns:
- Producer focuses on event generation
- Stream processor handles aggregation logic
- Consumer handles presentation/visualization
- Each component scales independently
Windowing Explained
Tumbling Windows (non-overlapping, fixed-size):
Time:  10:00  10:05  10:10  10:15
       |---W1---|---W2---|---W3---|

Window 1: Events from 10:00:00 - 10:04:59 → Emit at 10:05:00
Window 2: Events from 10:05:00 - 10:09:59 → Emit at 10:10:00
Window 3: Events from 10:10:00 - 10:14:59 → Emit at 10:15:00
- Each event belongs to exactly one window
- Windows close after fixed duration (5 minutes)
- Metrics emitted when window completes
- Processing time-based (not event time-based)
Production Considerations
Scalability:
- Kafka partitions: More partitions = higher throughput (e.g., increase from 6 to 12 partitions)
- Stream processor replicas: Scale up to match partition count (max replicas = number of partitions)
- Producer replicas: Multiple producers distribute load across Kafka brokers
- Consumer replicas: Up to partition count; same consumer group auto-balances load
Fault Tolerance:
- Kafka replication: Replication factor of 3 (survives up to 2 broker failures with
min.insync.replicas=2) - Consumer group offsets: Automatically tracked in Kafka; consumers resume from last committed offset after restart
- Stream processor state: Current implementation uses in-memory state (lost on restart)
- Production recommendation: Implement external state store (Redis, DynamoDB) for stateful recovery
- Pod restarts: Kubernetes automatically restarts failed pods
- Data durability: Kafka persists all events to disk with configurable retention
Monitoring:
- Grafana dashboards (pre-configured with Prometheus + Kafka Exporter):
- Strimzi Kafka Dashboard: Broker throughput, partition status, resource usage
- Strimzi Exporter Dashboard: Consumer lag by group, topic metrics, partition details
- Access via:
kubectl port-forward -n monitoring svc/kube-prometheus-stack-grafana 3000:80
- Key Prometheus metrics:
- Broker throughput:
kafka_server_brokertopicmetrics_messagesin_total - Consumer lag:
kafka_consumergroup_lag(monitorclickstream-processorgroup) - Under-replicated partitions:
kafka_server_replicamanager_underreplicatedpartitions
- Broker throughput:
- Stream processor metrics:
- Window completion rate (from application logs)
- Events processed per window (logged output: "✅ Window completed...")
- Pod health and restarts (Kubernetes metrics in Grafana)
- Application logs: Use
kubectl logs -for centralized logging (CloudWatch Logs, ELK stack) - Alerting: Configure Prometheus Alertmanager for consumer lag, broker failures, pod crashes
Processing Guarantees:
- At-least-once delivery: Current implementation with auto-commit offsets
- Idempotency: Enable idempotent producer (
enable.idempotence=true) to prevent duplicates - Exactly-once: Requires transactional producer/consumer (not implemented in this example)
Data Retention:
- Raw events: 24-hour retention allows recent event replay for reprocessing or debugging
- Aggregated metrics: 7-day retention for trend analysis and historical queries
- Long-term archival: Use Kafka Connect S3 Sink for indefinite storage in data lake
Security (not implemented in this example):
- Encryption in transit: Enable TLS for Kafka broker connections
- Authentication: SASL/SCRAM or mTLS for client authentication
- Authorization: Kafka ACLs to restrict topic access
- Network policies: Kubernetes NetworkPolicies to isolate components
Resource Management:
- CPU limits: Set appropriate limits to prevent noisy neighbor issues
- Memory limits: Size based on window duration and event volume (e.g., 512Mi-1Gi for stream processor)
- Disk I/O: Kafka brokers require fast storage (gp3 EBS volumes with provisioned IOPS)
- Network bandwidth: Monitor inter-broker and client-broker traffic