Create your own analytics dashboard
Pre-Requisites
On your Kibana cluster, click "Visualize" to create a new visualization. Below are some example to help you get started
Note: For each dashboard, you can get detailed data at user, queue, job or project level by simply using the "Filters" section
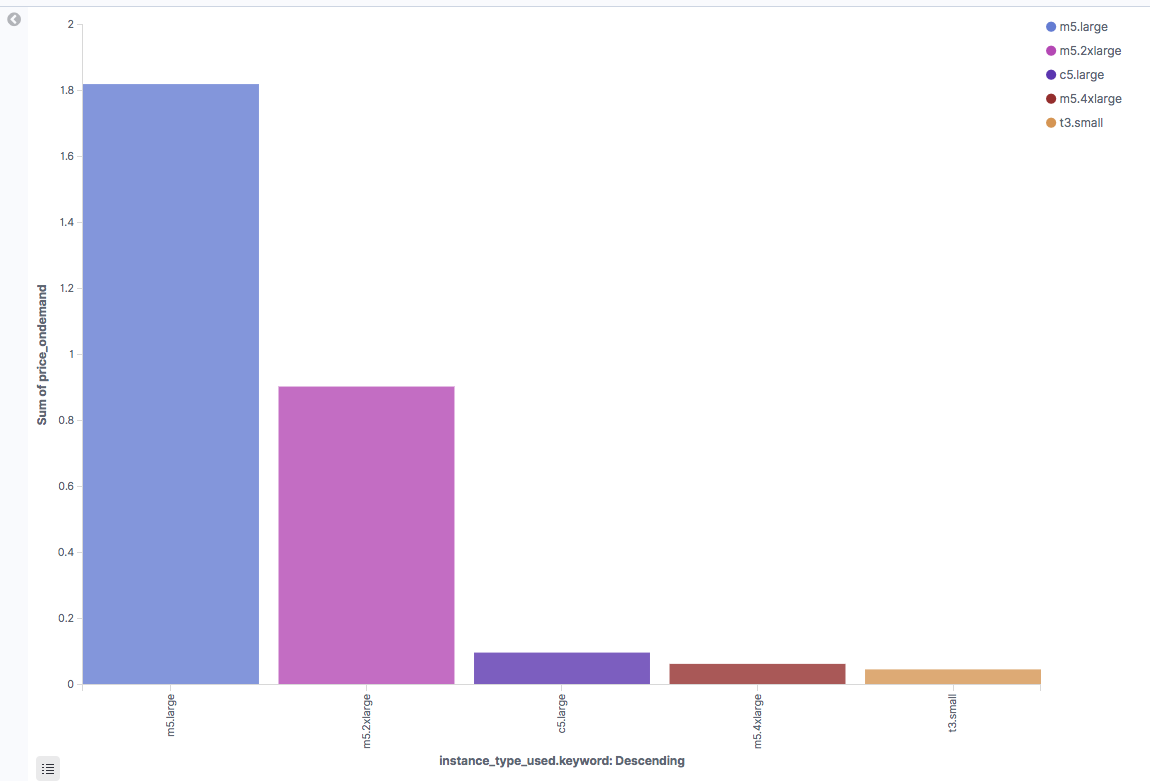
Money spent by instance type
Configuration
- Select "Vertical Bars" and "jobs" index
- Y Axis (Metrics):
- Aggregation: Sum
- Field: estimated_price_ondemand
- X Axis (Buckets):
- Aggregation: Terms
- Field: instance_type_used
- Order By: metric: Sum of estimated_price_ondemand
- Split Series (Buckets):
- Sub Aggregation: Terms
- Field: instance_type_used
- Order By: metric: Sum of estimated_price_ondemand
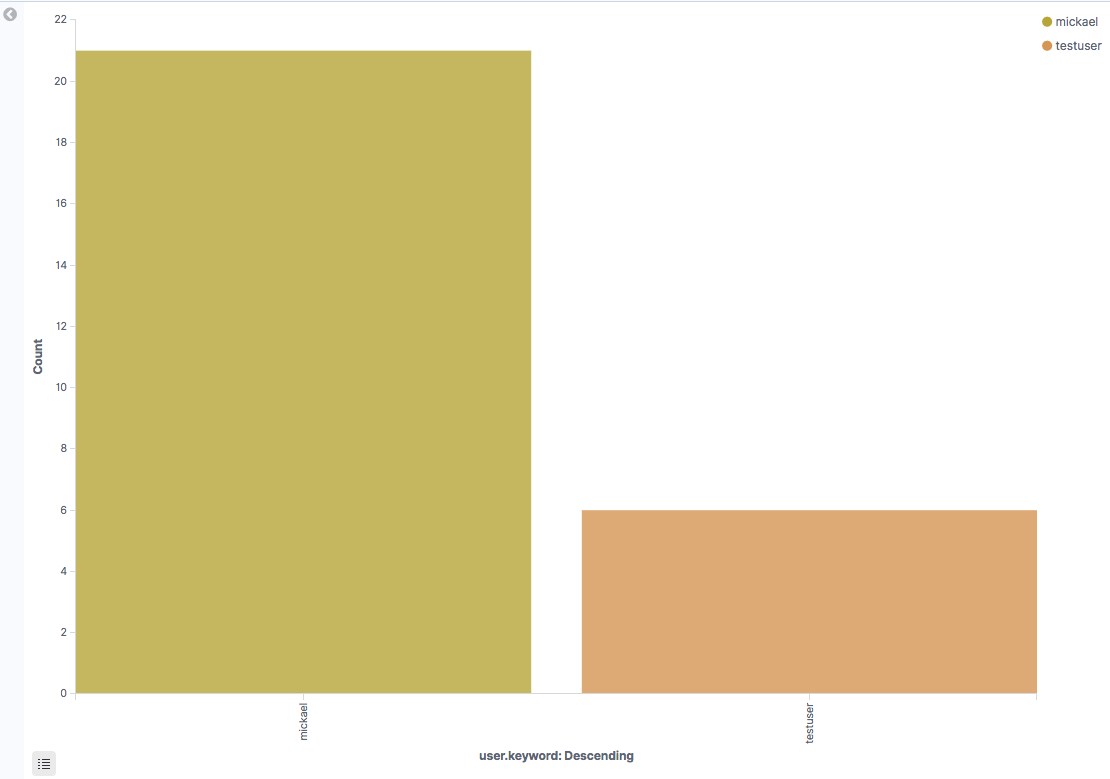
Jobs per user
Configuration
- Select "Vertical Bars" and "jobs" index
- Y Axis (Metrics):
- Aggregation: count
- X Axis (Buckets):
- Aggregation: Terms
- Field: user.keyword
- Order By: metric: Count
- Split Series (Buckets):
- Sub Aggregation: Terms
- Field: user.keyword
- Order By: metric: Count
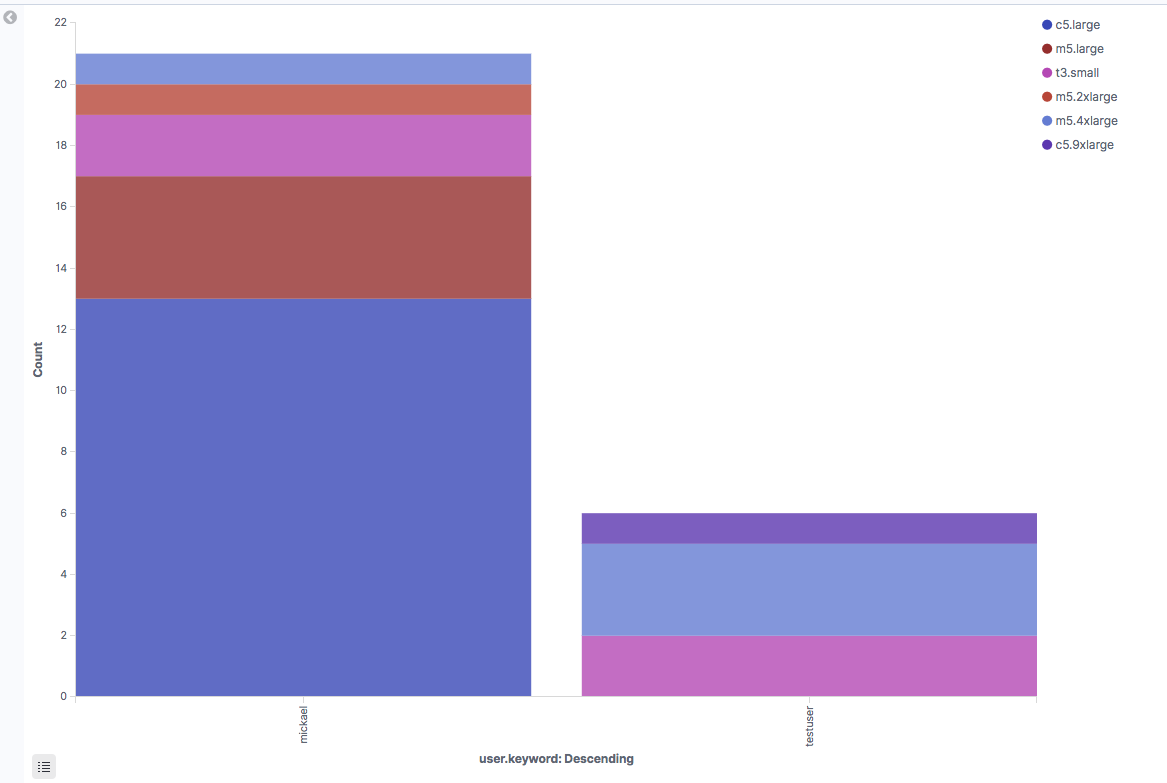
Jobs per user split by instance type
Configuration
- Select "Vertical Bars" and "jobs" index
- Y Axis (Metrics):
- Aggregation: count
- X Axis (Buckets):
- Aggregation: Terms
- Field: user.keyword
- Order By: metric: Count
- Split Series (Buckets):
- Sub Aggregation: Terms
- Field: instance_type_used
- Order By: metric: Count
Most active projects
Configuration
- Select "Pie" and "jobs" index
- Slice Size (Metrics):
- Aggregation: Count
- Split Slices (Buckets):
- Aggregation: Terms
- Field: project.keyword
- Order By: metric: Count
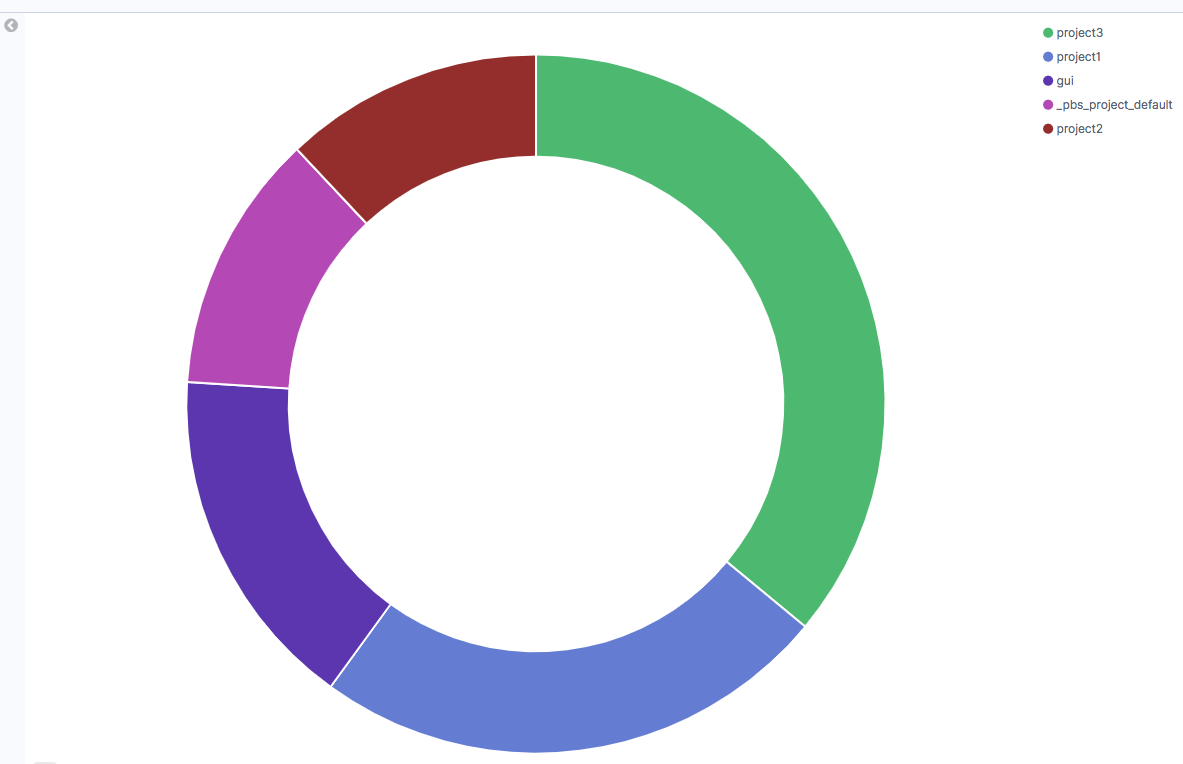
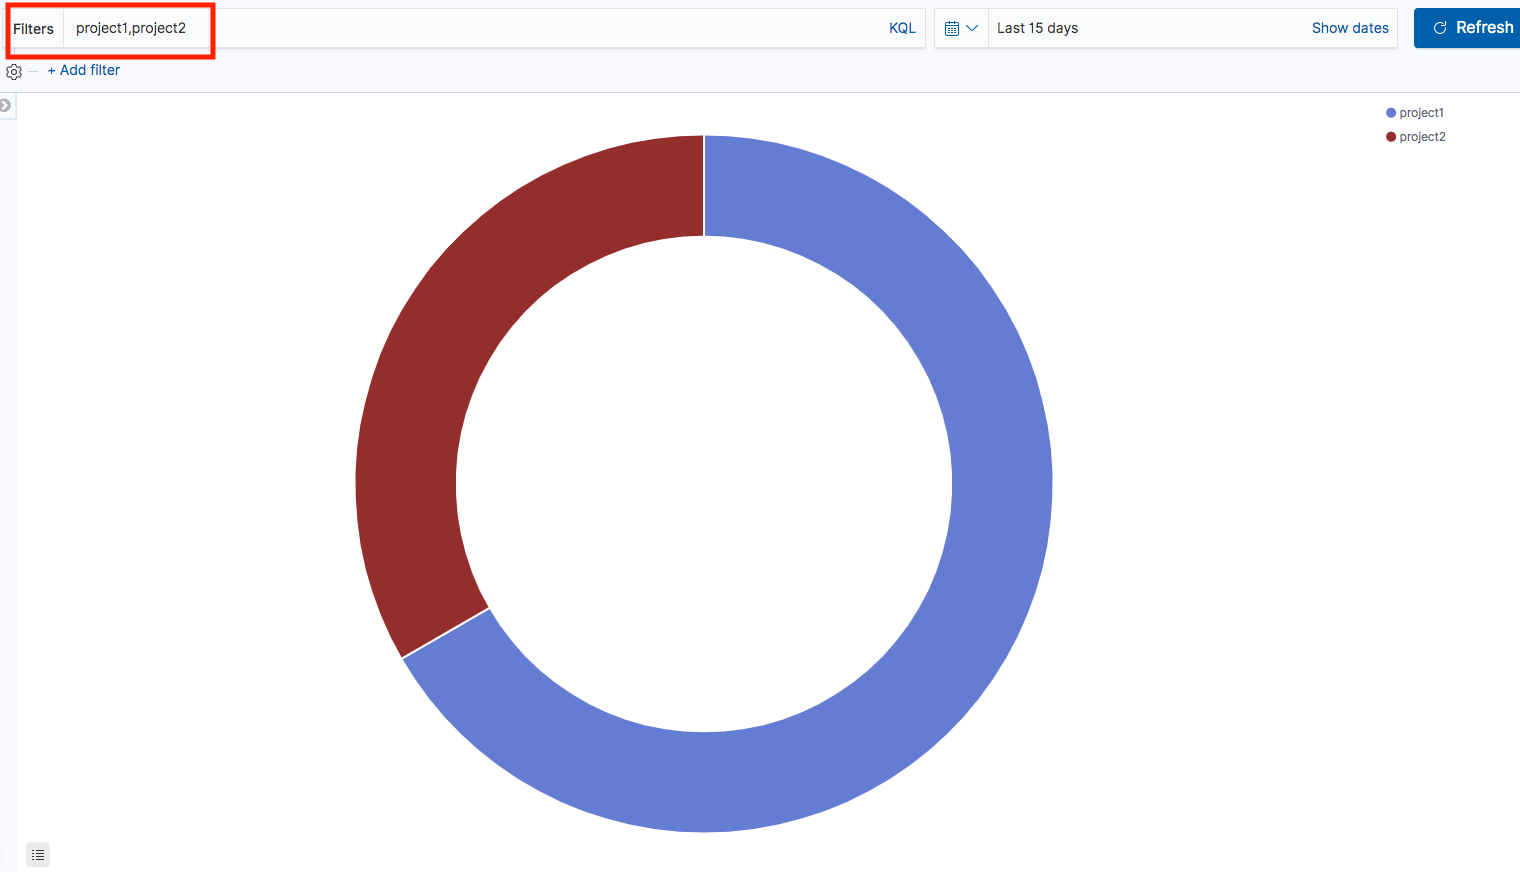
If needed, you can filter by project name (note: this type of filtering can be applied to all type of dashboard)
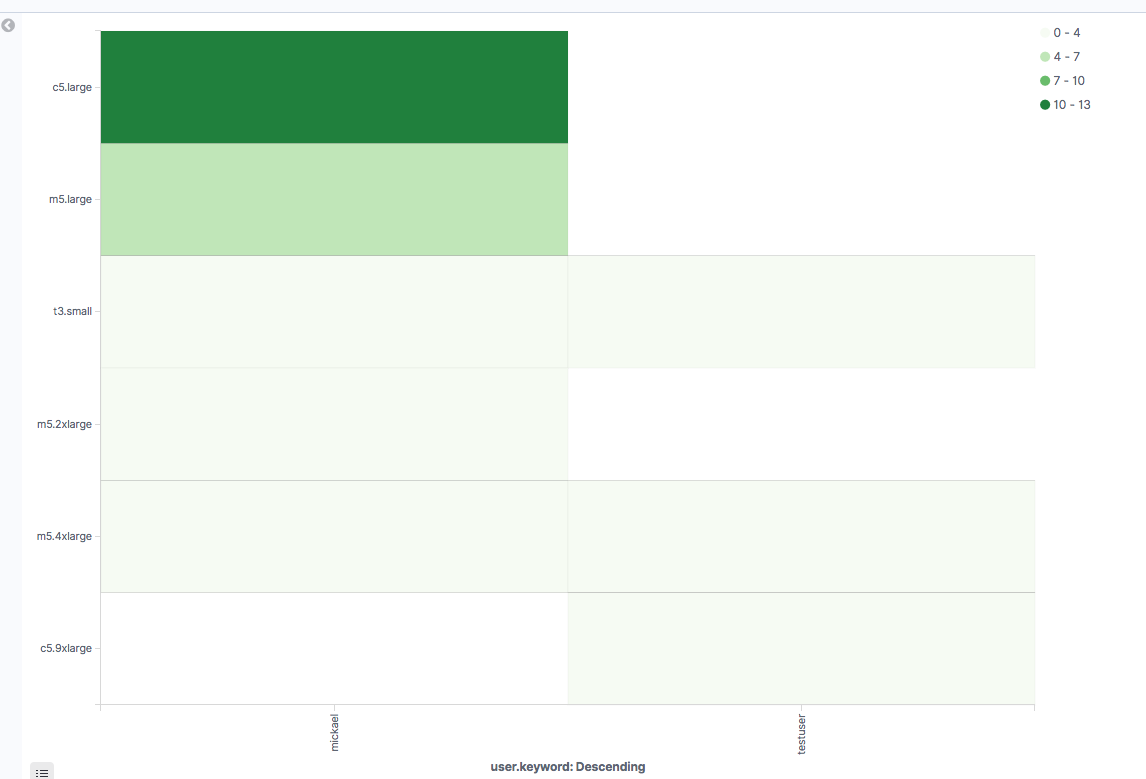
Instance type launched by user
Configuration
- Select "Heat Map" and "jobs" index
- Value (Metrics):
- Aggregation: Count
- Y Axis (Buckets):
- Aggregation: Term
- Field: instance_type_used
- Order By: metric: Count
- X Axis (Buckets):
- Aggregation: Terms
- Field: user
- Order By: metric: Count
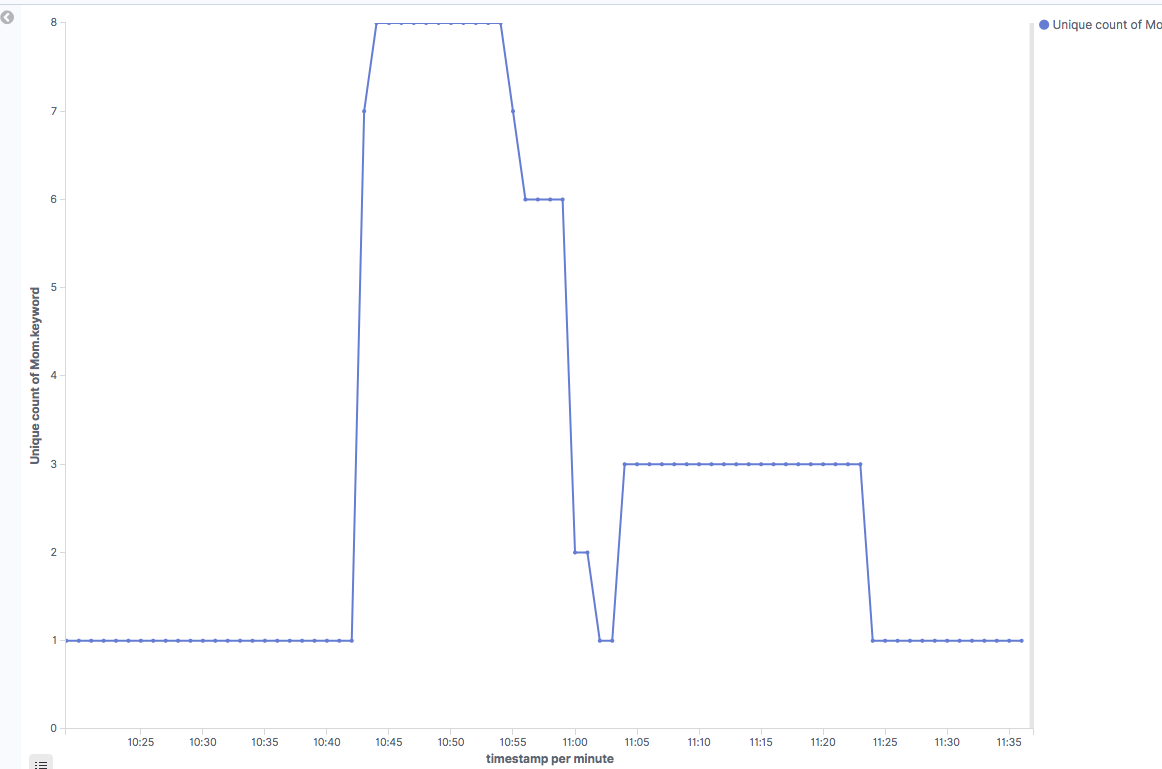
Number of nodes in the cluster
Configuration
- Select "Lines" and "pbsnodes" index
- Y Axis (Metrics):
- Aggregation: Unique Count
- Field: Mom.keyword
- X Axis (Buckets):
- Aggregation: Date Histogram,
- Field: timestamp
- Interval: Minute
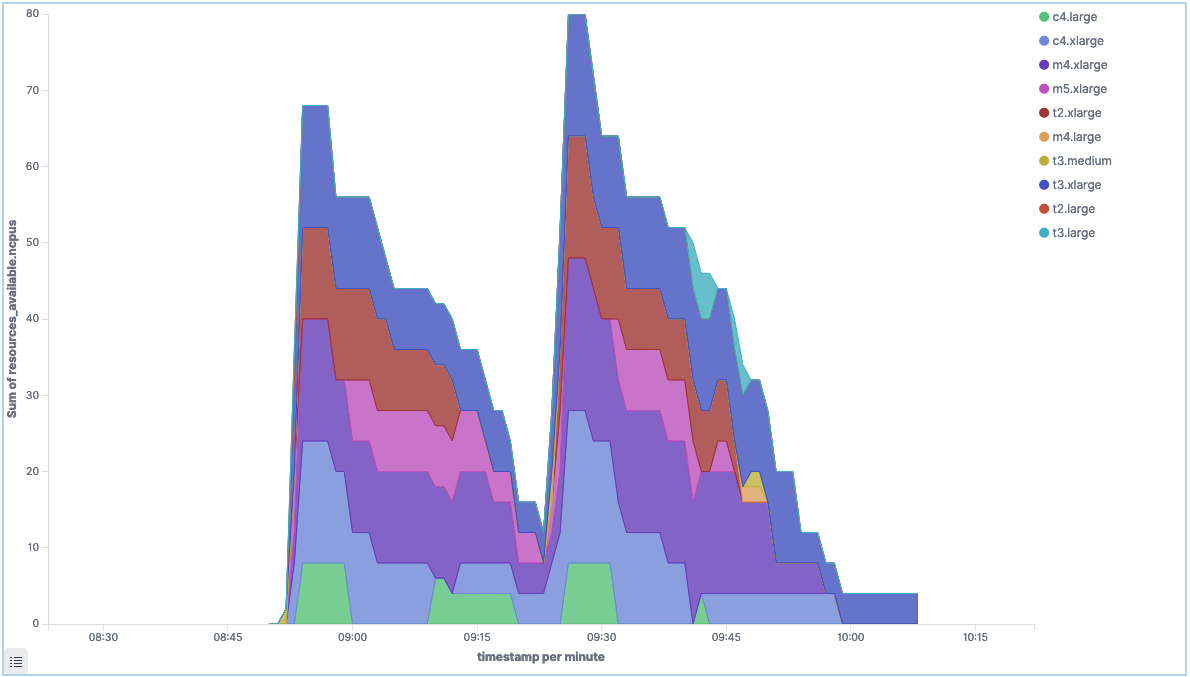
Total number of CPUs by instance type
Configuration
- Select "Area" and "pbsnodes" index
- Y Axis (Metrics):
- Aggregation: Sum
- Field: resources_available.ncpus
- X Axis (Buckets):
- Aggregation: Date Histogram,
- Field: timestamp
- Interval: minute
- Split Series (Buckets):
- Sub Aggregation: Terms
- Field: resources_available.instance_type.keyword
- Order By: metric: Sum
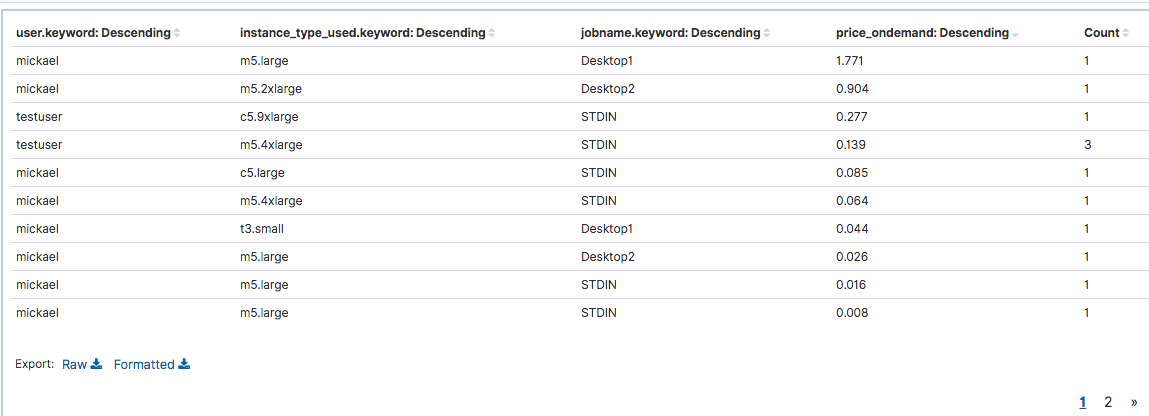
Detailed information per user
Configuration
- Select "Datatables" and "jobs" index
- Metric (Metrics):
- Aggregation: Count
- Split Rows (Buckets):
- Aggregation: Term
- Field: user.keyword
- Order By: metric: Count
- Split Rows (Buckets):
- Aggregation: Term
- Field: instance_type_used.keyword
- Order By: metric: Count
- Split Rows (Buckets):
- Aggregation: Term
- Field: price_ondemand.keyword
- Order By: metric: Count
- Split Rows (Buckets):
- Aggregation: Term
- Field: job_name.keyword
- Order By: metric: Count
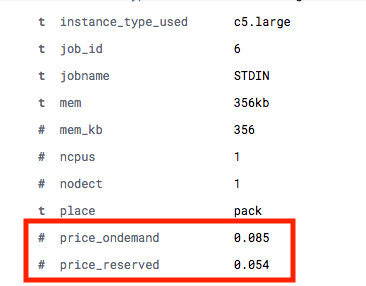
Find the price for a given simulation
Each job comes with price_ondemand and price_reserved attributes which are calculated based on: number of nodes * ( simulation_hours * instance_hourly_rate )