Inference-Ready EKS Cluster
The Inference-Ready EKS Cluster is a pre-configured infrastructure solution designed specifically for AI/ML inference workloads. This solution provides a Kubernetes cluster with all the necessary components to deploy and run inference services using the AI on EKS inference charts or your own deployments and models.
An expanded Readme is available that dives deep into the infrastructure. This page highlights the core components and reasoning for this architecture.
Why?
This Inference-Ready EKS Cluster was created to enable anyone to use EKS for inference, no matter where they are on their journey. LLMs can be challenging to deploy: depending on the model size, architecture, capabilities, and your requirements, different tools are needed to properly deploy, run, and scale the model. Additionally, you may want to run models that aren't just LLMs, such as text -> image diffusion models or more traditional Machine Learning models.
This infrastructure is meant to be the first layer of support. Alongside the Inference Charts and the Guidance you'll also find in this repository, AI on EKS aims to equip you with all the tools and knowledge you need to be able to run the inference you want.
Use Cases
- Single Model Testing: If you just want to deploy a model and test it to see what it does or how well it does.
- Multi-Node Distributed Inference: If the model is too big to fit on a single node.
- Model Autoscaling: If you need to dynamically adjust the amount of models running based on incoming requests and queue length.
- Model Benchmarking: If you want to understand how your model will perform on a given dataset with differing traffic patterns. This helps you adjust the model parameters and replicas to meet your Service Level Objectives ( SLOs).
- Muti Model Architectures: If you want to test both LLMs and text->image diffusion models.
Introduction
This infrastructure creates an Amazon EKS cluster optimized for AI/ML inference workloads with the following key features:
- KubeRay Operator: Enables distributed Ray workloads for scalable inference
- LeaderWorkerSet: Enables multi-node distributed inference
- AIBrix Stack: Advanced inference optimization and management capabilities
- GPU/Neuron Support: Ready for both NVIDIA GPU and AWS Neuron (Inferentia/Trainium) workloads
- AI/ML Observability Stack: Comprehensive monitoring and observability for ML workloads
- Autoscaling: Karpenter-based node autoscaling for cost optimization
The cluster is specifically designed to work seamlessly with the AI on EKS Inference Charts, providing a complete end-to-end solution for deploying inference workloads.
Resources
This infrastructure deploys the following AWS resources:
Core Infrastructure
- Amazon VPC with public and private subnets across multiple AZs
- Amazon EKS Cluster (v1.33 by default)
- EKS Managed Node Groups: Auto-scaling groups of EC2 instances that serve as EKS compute nodes.
- NAT Gateways for private subnet internet access
- Internet Gateway for public subnet access
- Security Groups with appropriate ingress/egress rules
EKS Add-ons
- AWS Load Balancer Controller for ingress management
- EBS CSI Driver for persistent storage
- VPC CNI for pod networking
- CoreDNS for service discovery
- Kube-proxy for service networking
- Metrics Server for resource metrics
- Amazon CloudWatch Observability for logging and monitoring
AI/ML Specific Components
- KubeRay Operator for distributed Ray workloads
- LeaderWorkerSet for multi-node distributed inference
- NVIDIA Device Plugin for GPU resource management
- AWS Neuron Device Plugin for Inferentia/Trainium support
- Karpenter for intelligent node autoscaling
Observability Stack
- Prometheus for metrics collection
- Grafana for visualization and dashboards
- AlertManager for alerting
- Node Exporter for node-level metrics
- DCGM Exporter for GPU metrics (when GPU nodes are present)
AIBrix Components
- AIBrix Core for inference optimization
- Gateway and routing for traffic management
- Performance monitoring and optimization tools
Deployment
Architecture Diagram
Prerequisites
- AWS CLI configured with appropriate permissions
- Terraform (>= 1.0)
- kubectl for cluster management
- Helm (>= 3.0) for chart deployments
Step 0: Clone and Navigate
git clone https://github.com/awslabs/ai-on-eks.git
cd infra/solutions/inference-ready-cluster
Step 1: (Optional) Configure Variables
Edit the terraform/blueprint.tfvars file to customize your deployment:
name                             = "my-inference-cluster"
region                           = "us-west-2"
enable_kuberay_operator          = true
enable_ai_ml_observability_stack = true
enable_aibrix_stack              = true
enable_leader_worker_set         = true
availability_zones_count         = 4
All variables can be found in the
variables.tf file
Step 2: Deploy Infrastructure
# Run the installation script
./install.sh
The installation script will do the following automatically:
- Copy the base Terraform configuration
- Initialize Terraform
- Plan and apply the infrastructure
- Configure kubectl context
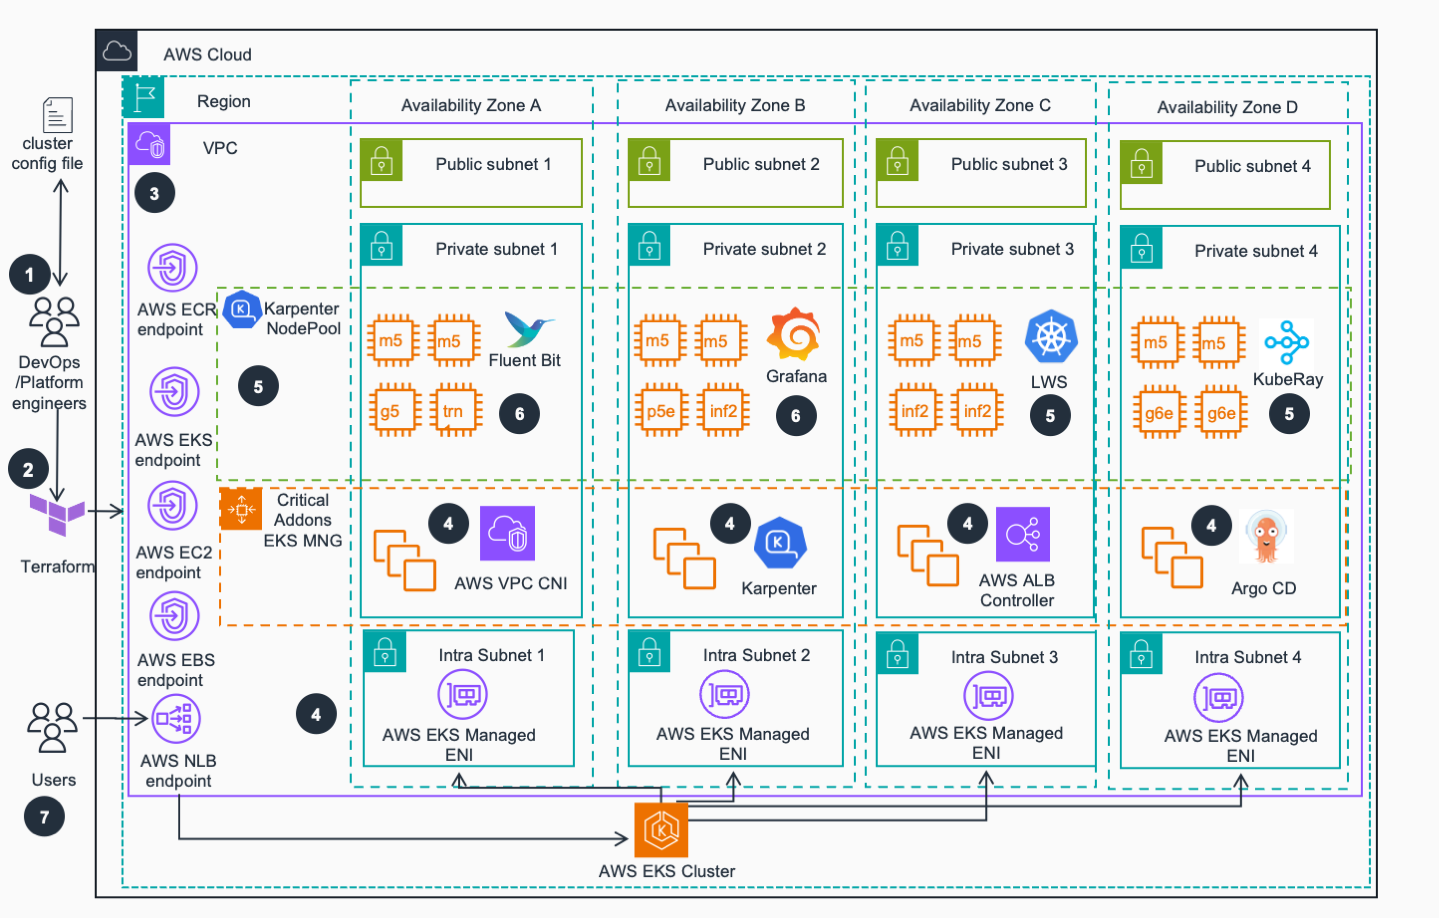
Step 3: VPC
An Amazon Virtual Private Network (VPC) is provisioned and configured based on specified configuration. According to best practices for Reliability, 4 Availability zones (AZs) are configured to provide the best chance of node acquisition and high availability. Topology awareness defaults to keep AI/ML workloads in the same AZ for performance/cost, but is configurable for availability.
Step 4: EKS
Amazon Elastic Kubernetes Service (EKS) cluster is provisioned with Managed Nodes Group (MNG) that run critical cluster add-ons (CoreDNS, AWS Load Balancer Controller and Karpenter) on its compute nodes. Karpenter will manage compute capacity to other EKS add-ons, as well as inference applications that will be deployed by user while prioritizing the most cost-effective instances, per configuration.
Step 5: EKS add-ons
Other important EKS add-ons (LWS, KubeRay etc.) are deployed based on the configurations defined in the per-environment Terraform configuration file (See Step 1 above)
Step 6: Observability
An observability stack including FluentBit, Prometheus and Grafana is deployed to collect metrics and logs from the environment. Service and Pod Monitors are deployed to watch for AI/ML related workloads and collect metrics. Grafana dashboards are configured to automatically visualize the metrics and logs side by side.
Step 7: Cluster Ready
Users can access EKS API and can deploy containerized AI/ML inference workloads via Kubernetes CLI using the AI on EKS inference charts or other repositories by interacting with AWS Network Load Balancer (NLB) endpoint.
Step 8: Verify Deployment
To validate that everything deployed properly, you can run
kubectl get svc,pod,deployment -A
You should see the following output (expand the section to see the output)
Details
NAMESPACE NAME TYPE CLUSTER-IP EXTERNAL-IP PORT(S) AGE
aibrix-system service/aibrix-controller-manager-metrics-service ClusterIP 172.20.218.39 <none> 8080/TCP 13d
aibrix-system service/aibrix-gateway-plugins ClusterIP 172.20.142.245 <none> 50052/TCP 13d
aibrix-system service/aibrix-gpu-optimizer ClusterIP 172.20.14.220 <none> 8080/TCP 13d
aibrix-system service/aibrix-kuberay-operator ClusterIP 172.20.240.255 <none> 8080/TCP 13d
aibrix-system service/aibrix-metadata-service ClusterIP 172.20.252.24 <none> 8090/TCP 13d
aibrix-system service/aibrix-redis-master ClusterIP 172.20.155.43 <none> 6379/TCP 13d
argocd service/argocd-applicationset-controller ClusterIP 172.20.139.94 <none> 7000/TCP 13d
argocd service/argocd-dex-server ClusterIP 172.20.127.60 <none> 5556/TCP,5557/TCP 13d
argocd service/argocd-redis ClusterIP 172.20.48.202 <none> 6379/TCP 13d
argocd service/argocd-repo-server ClusterIP 172.20.232.147 <none> 8081/TCP 13d
argocd service/argocd-server ClusterIP 172.20.233.191 <none> 80/TCP,443/TCP 13d
default service/etcd-client ClusterIP 172.20.47.224 <none> 2379/TCP 12d
default service/etcd-server ClusterIP 172.20.69.95 <none> 2379/TCP,2380/TCP 12d
default service/kubernetes ClusterIP 172.20.0.1 <none> 443/TCP 13d
envoy-gateway-system service/envoy-aibrix-system-aibrix-eg-903790dc ClusterIP 172.20.249.100 <none> 80/TCP 13d
envoy-gateway-system service/envoy-gateway ClusterIP 172.20.113.229 <none> 18000/TCP,18001/TCP,18002/TCP,19001/TCP 13d
ingress-nginx service/ingress-nginx-controller LoadBalancer 172.20.27.209 k8s-ingressn-ingressn-ffa534dcb1-b4b54bcc24eaeddd.elb.us-west-2.amazonaws.com 80:31646/TCP,443:32024/TCP 13d
ingress-nginx service/ingress-nginx-controller-admission ClusterIP 172.20.249.118 <none> 443/TCP 13d
karpenter service/karpenter ClusterIP 172.20.149.70 <none> 8080/TCP 13d
kube-system service/aws-load-balancer-webhook-service ClusterIP 172.20.83.104 <none> 443/TCP 13d
kube-system service/eks-extension-metrics-api ClusterIP 172.20.87.142 <none> 443/TCP 13d
kube-system service/k8s-neuron-scheduler ClusterIP 172.20.248.128 <none> 12345/TCP 13d
kube-system service/kube-dns ClusterIP 172.20.0.10 <none> 53/UDP,53/TCP,9153/TCP 13d
kube-system service/kube-prometheus-stack-kubelet ClusterIP None <none> 10250/TCP,10255/TCP,4194/TCP 13d
kuberay-operator service/kuberay-operator ClusterIP 172.20.117.159 <none> 8080/TCP 13d
lws-system service/lws-controller-manager-metrics-service ClusterIP 172.20.17.186 <none> 8443/TCP 13d
lws-system service/lws-webhook-service ClusterIP 172.20.173.201 <none> 443/TCP 13d
monitoring service/alertmanager-operated ClusterIP None <none> 9093/TCP,9094/TCP,9094/UDP 13d
monitoring service/dcgm-exporter ClusterIP 172.20.79.5 <none> 9400/TCP 13d
monitoring service/fluent-bit ClusterIP 172.20.111.213 <none> 2020/TCP 13d
monitoring service/kube-prometheus-stack-alertmanager ClusterIP 172.20.45.163 <none> 9093/TCP,8080/TCP 13d
monitoring service/kube-prometheus-stack-coredns ClusterIP None <none> 9153/TCP 13d
monitoring service/kube-prometheus-stack-grafana ClusterIP 172.20.251.144 <none> 80/TCP 13d
monitoring service/kube-prometheus-stack-kube-controller-manager ClusterIP None <none> 10257/TCP 13d
monitoring service/kube-prometheus-stack-kube-etcd ClusterIP None <none> 2381/TCP 13d
monitoring service/kube-prometheus-stack-kube-proxy ClusterIP None <none> 10249/TCP 13d
monitoring service/kube-prometheus-stack-kube-scheduler ClusterIP None <none> 10259/TCP 13d
monitoring service/kube-prometheus-stack-kube-state-metrics ClusterIP 172.20.81.57 <none> 8080/TCP 13d
monitoring service/kube-prometheus-stack-operator ClusterIP 172.20.163.90 <none> 443/TCP 13d
monitoring service/kube-prometheus-stack-prometheus ClusterIP 172.20.1.251 <none> 9090/TCP,8080/TCP 13d
monitoring service/kube-prometheus-stack-prometheus-node-exporter ClusterIP 172.20.88.160 <none> 9100/TCP 13d
monitoring service/my-cluster ClusterIP 172.20.54.44 <none> 9200/TCP,9300/TCP,9600/TCP,9650/TCP 13d
monitoring service/my-cluster-dashboards ClusterIP 172.20.161.35 <none> 5601/TCP 13d
monitoring service/my-cluster-masters ClusterIP None <none> 9200/TCP,9300/TCP 13d
monitoring service/opencost ClusterIP 172.20.162.78 <none> 9003/TCP,9090/TCP 13d
monitoring service/opensearch-discovery ClusterIP None <none> 9300/TCP 13d
monitoring service/opensearch-operator-controller-manager-metrics-service ClusterIP 172.20.183.236 <none> 8443/TCP 13d
monitoring service/prometheus-operated ClusterIP None <none> 9090/TCP 13d
NAMESPACE NAME READY STATUS RESTARTS AGE
aibrix-system pod/aibrix-controller-manager-5948f8f8b7-qjm7z 1/1 Running 0 13d
aibrix-system pod/aibrix-gateway-plugins-5978d98445-qj2jw 1/1 Running 0 13d
aibrix-system pod/aibrix-gpu-optimizer-64c978ddd8-bw7hk 1/1 Running 0 13d
aibrix-system pod/aibrix-kuberay-operator-8b65d7cc4-xrcm6 1/1 Running 0 13d
aibrix-system pod/aibrix-metadata-service-5499dc64b7-69tzc 1/1 Running 0 13d
aibrix-system pod/aibrix-redis-master-576767646c-w9lhl 1/1 Running 0 13d
argocd pod/argocd-application-controller-0 1/1 Running 0 13d
argocd pod/argocd-applicationset-controller-6847f76cb8-svwvt 1/1 Running 0 13d
argocd pod/argocd-dex-server-f6d74975f-g5rj8 1/1 Running 0 13d
argocd pod/argocd-notifications-controller-86f4bb887d-sgxlb 1/1 Running 0 13d
argocd pod/argocd-redis-588f9bcd4d-9tncd 1/1 Running 0 13d
argocd pod/argocd-repo-server-5cbcc778f4-kd4ll 1/1 Running 0 13d
argocd pod/argocd-server-7c9898bc58-vfqwn 1/1 Running 0 13d
envoy-gateway-system pod/envoy-aibrix-system-aibrix-eg-903790dc-567ff75b87-22ctt 2/2 Running 0 13d
envoy-gateway-system pod/envoy-gateway-6d7859b6bf-6hhf5 1/1 Running 0 13d
ingress-nginx pod/ingress-nginx-controller-58f4c5584-wt6rk 1/1 Running 0 13d
karpenter pod/karpenter-849fd44788-4fgml 1/1 Running 0 13d
karpenter pod/karpenter-849fd44788-zbm9z 1/1 Running 0 13d
kube-system pod/aws-load-balancer-controller-c495bf799-crnlh 1/1 Running 0 13d
kube-system pod/aws-load-balancer-controller-c495bf799-nwkqv 1/1 Running 0 13d
kube-system pod/aws-node-6ff6l 2/2 Running 0 8d
kube-system pod/aws-node-728vt 2/2 Running 0 2d16h
kube-system pod/aws-node-87jfl 2/2 Running 0 13d
kube-system pod/aws-node-wtnlj 2/2 Running 0 13d
kube-system pod/aws-node-zzc4g 2/2 Running 0 2d16h
kube-system pod/coredns-7bf648ff5d-98bp4 1/1 Running 0 13d
kube-system pod/coredns-7bf648ff5d-w56nm 1/1 Running 0 13d
kube-system pod/ebs-csi-controller-5bdc7bfdb6-79658 6/6 Running 0 13d
kube-system pod/ebs-csi-controller-5bdc7bfdb6-958zf 6/6 Running 0 13d
kube-system pod/ebs-csi-node-4z2mb 3/3 Running 0 13d
kube-system pod/ebs-csi-node-8qq2s 3/3 Running 0 2d16h
kube-system pod/ebs-csi-node-q9h5r 3/3 Running 0 2d16h
kube-system pod/ebs-csi-node-t77j9 3/3 Running 0 13d
kube-system pod/ebs-csi-node-w9mh8 3/3 Running 0 8d
kube-system pod/eks-pod-identity-agent-jjfz4 1/1 Running 0 13d
kube-system pod/eks-pod-identity-agent-jthdk 1/1 Running 0 2d16h
kube-system pod/eks-pod-identity-agent-ng556 1/1 Running 0 8d
kube-system pod/eks-pod-identity-agent-q6ths 1/1 Running 0 2d16h
kube-system pod/eks-pod-identity-agent-rwkr9 1/1 Running 0 13d
kube-system pod/k8s-neuron-scheduler-56f6c8bd67-hbzgz 1/1 Running 0 13d
kube-system pod/kube-proxy-4wf7s 1/1 Running 0 2d16h
kube-system pod/kube-proxy-7dm2x 1/1 Running 0 2d16h
kube-system pod/kube-proxy-9d9cm 1/1 Running 0 8d
kube-system pod/kube-proxy-lt4sp 1/1 Running 0 13d
kube-system pod/kube-proxy-nklwj 1/1 Running 0 13d
kube-system pod/my-scheduler-6959876cb4-gprm5 1/1 Running 0 13d
kuberay-operator pod/kuberay-operator-6d988d7dd9-ncx4h 1/1 Running 0 13d
lws-system pod/lws-controller-manager-cbb85458b-7cvhr 1/1 Running 0 13d
lws-system pod/lws-controller-manager-cbb85458b-dqj8g 1/1 Running 0 13d
monitoring pod/alertmanager-kube-prometheus-stack-alertmanager-0 2/2 Running 0 13d
monitoring pod/fluent-bit-52m29 1/1 Running 0 2d16h
monitoring pod/fluent-bit-hb824 1/1 Running 0 13d
monitoring pod/fluent-bit-hsptw 1/1 Running 0 13d
monitoring pod/fluent-bit-nkmrq 1/1 Running 0 8d
monitoring pod/fluent-bit-qdsm2 1/1 Running 0 2d16h
monitoring pod/fluent-operator-7f75b8ccf4-z5924 1/1 Running 0 13d
monitoring pod/kube-prometheus-stack-grafana-c64f79c4f-zqlm7 3/3 Running 0 13d
monitoring pod/kube-prometheus-stack-kube-state-metrics-77976dc6c4-fff28 1/1 Running 0 13d
monitoring pod/kube-prometheus-stack-operator-6655669d75-4kh9s 1/1 Running 0 13d
monitoring pod/kube-prometheus-stack-prometheus-node-exporter-7xbrs 1/1 Running 0 13d
monitoring pod/kube-prometheus-stack-prometheus-node-exporter-gwkb2 1/1 Running 0 13d
monitoring pod/kube-prometheus-stack-prometheus-node-exporter-k6zl7 1/1 Running 0 2d16h
monitoring pod/kube-prometheus-stack-prometheus-node-exporter-pl6m7 1/1 Running 0 2d16h
monitoring pod/kube-prometheus-stack-prometheus-node-exporter-st9kp 1/1 Running 0 8d
monitoring pod/opencost-bd64bfbf5-jbfvr 2/2 Running 0 13d
monitoring pod/opensearch-dashboards-84675f8b9-6jd2h 1/1 Running 0 13d
monitoring pod/opensearch-dashboards-84675f8b9-9mcs2 1/1 Running 0 13d
monitoring pod/opensearch-masters-0 1/1 Running 0 13d
monitoring pod/opensearch-masters-1 1/1 Running 0 8d
monitoring pod/opensearch-masters-2 1/1 Running 0 8d
monitoring pod/opensearch-operator-controller-manager-58b76955b9-w46gl 2/2 Running 0 13d
monitoring pod/opensearch-securityconfig-update-4fdcz 0/1 Completed 0 13d
monitoring pod/prometheus-kube-prometheus-stack-prometheus-0 2/2 Running 0 13d
nvidia-device-plugin pod/nvidia-device-plugin-node-feature-discovery-master-77b96ddp8h25 1/1 Running 0 13d
NAMESPACE NAME READY UP-TO-DATE AVAILABLE AGE
aibrix-system deployment.apps/aibrix-controller-manager 1/1 1 1 13d
aibrix-system deployment.apps/aibrix-gateway-plugins 1/1 1 1 13d
aibrix-system deployment.apps/aibrix-gpu-optimizer 1/1 1 1 13d
aibrix-system deployment.apps/aibrix-kuberay-operator 1/1 1 1 13d
aibrix-system deployment.apps/aibrix-metadata-service 1/1 1 1 13d
aibrix-system deployment.apps/aibrix-redis-master 1/1 1 1 13d
argocd deployment.apps/argocd-applicationset-controller 1/1 1 1 13d
argocd deployment.apps/argocd-dex-server 1/1 1 1 13d
argocd deployment.apps/argocd-notifications-controller 1/1 1 1 13d
argocd deployment.apps/argocd-redis 1/1 1 1 13d
argocd deployment.apps/argocd-repo-server 1/1 1 1 13d
argocd deployment.apps/argocd-server 1/1 1 1 13d
envoy-gateway-system deployment.apps/envoy-aibrix-system-aibrix-eg-903790dc 1/1 1 1 13d
envoy-gateway-system deployment.apps/envoy-gateway 1/1 1 1 13d
ingress-nginx deployment.apps/ingress-nginx-controller 1/1 1 1 13d
karpenter deployment.apps/karpenter 2/2 2 2 13d
kube-system deployment.apps/aws-load-balancer-controller 2/2 2 2 13d
kube-system deployment.apps/coredns 2/2 2 2 13d
kube-system deployment.apps/ebs-csi-controller 2/2 2 2 13d
kube-system deployment.apps/k8s-neuron-scheduler 1/1 1 1 13d
kube-system deployment.apps/my-scheduler 1/1 1 1 13d
kuberay-operator deployment.apps/kuberay-operator 1/1 1 1 13d
lws-system deployment.apps/lws-controller-manager 2/2 2 2 13d
monitoring deployment.apps/fluent-operator 1/1 1 1 13d
monitoring deployment.apps/kube-prometheus-stack-grafana 1/1 1 1 13d
monitoring deployment.apps/kube-prometheus-stack-kube-state-metrics 1/1 1 1 13d
monitoring deployment.apps/kube-prometheus-stack-operator 1/1 1 1 13d
monitoring deployment.apps/opencost 1/1 1 1 13d
monitoring deployment.apps/opensearch-dashboards 2/2 2 2 13d
monitoring deployment.apps/opensearch-operator-controller-manager 1/1 1 1 13d
nvidia-device-plugin deployment.apps/nvidia-device-plugin-node-feature-discovery-master 1/1 1 1 13d
Inference on EKS
EKS is a powerful platform for running AI/ML inference. For a deep dive on many of the inference possibilities on EKS, please check the inference section.
Inference Charts Integration
This infrastructure is specifically designed to work with the AI on EKS Inference Charts. The cluster provides all the necessary components and configurations for seamless deployment of inference workloads.
Prerequisites for Inference Charts
The infrastructure automatically provides:
- KubeRay Operator - Required for Ray-vLLM deployments
- GPU/Neuron Device Plugins - For hardware resource management
- Observability Stack - Prometheus and Grafana for monitoring
- AIBrix Integration - For inference optimization and management
Supported Inference Patterns
The cluster supports all inference patterns provided by the inference charts:
vLLM Deployments
- Direct vLLM deployment using Kubernetes Deployment
- Suitable for single-node inference workloads
- Supports both GPU and Neuron accelerators
Ray-vLLM Deployments
- Distributed vLLM on Ray Serve
- Automatic scaling based on workload demand
- Advanced observability with Prometheus/Grafana integration
- Topology-aware scheduling for optimal performance
AIBrix Deployments
- AIBrix backed LLM deployments
- Efficient LLM routing for multiple replicas
- Supports mixed GPU and Neuron accelerators
Example Deployments
Once your cluster is ready, you can deploy inference workloads:
# Create Hugging Face token secret
kubectl create secret generic hf-token --from-literal=token=your_hf_token

# Deploy GPU Qwen 3 1.7B model with vLLM
helm repo add ai-on-eks https://awslabs.github.io/ai-on-eks-charts/
helm repo update

helm install qwen3-1-7b ai-on-eks/inference-charts -f https://raw.githubusercontent.com/awslabs/ai-on-eks-charts/refs/heads/main/charts/inference-charts/values-qwen3-1.7b-vllm.yaml
Please check the inference charts section for a deeper look at what is available.
Observability Integration
The infrastructure provides comprehensive observability for inference workloads:
- Prometheus Metrics: Automatic collection of inference metrics
- Grafana Dashboards: Pre-configured dashboards for Ray and vLLM
- Log Aggregation: Centralized logging with Fluent Bit
- GPU/Neuron Monitoring: Hardware utilization metrics
Access Grafana dashboard:
kubectl port-forward -n monitoring svc/kube-prometheus-stack-grafana 3000:80
Please see the observability for an in-depth look at using the observability features.
Cost Optimization
The cluster includes several cost optimization features:
- Karpenter Autoscaling: Automatic node provisioning and deprovisioning
- Spot Instance Support: Configure node groups to use spot instances
- Topology Awareness: Efficient resource utilization across AZs
- Resource Limits: Proper resource requests and limits for workloads
Troubleshooting
This section covers common issues you may encounter when deploying and operating the inference-ready EKS cluster, along with detailed solutions and diagnostic steps.
Deployment Issues
1. Terraform Apply Failures
Symptoms:
- Terraform fails during
terraform applywith resource creation errors - Module-specific failures during sequential deployment
Common Causes & Solutions:
Insufficient AWS Permissions:
# Verify your AWS credentials and permissions
aws sts get-caller-identity
aws iam get-user

# Required permissions include:
# - EKS cluster creation and management
# - EC2 instance management
# - VPC and networking resources
# - IAM role creation and attachment
# - KMS key management
Service Quota Limits:
# Check EC2 service quotas
aws service-quotas get-service-quota --service-code ec2 --quota-code L-1216C47A  # Running On-Demand instances
aws service-quotas get-service-quota --service-code ec2 --quota-code L-34B43A08  # Running On-Demand G instances
aws service-quotas get-service-quota --service-code ec2 --quota-code L-6E869C2A  # Running On-Demand Inf instances

# Request quota increases if needed
aws service-quotas request-service-quota-increase --service-code ec2 --quota-code L-34B43A08 --desired-value 32
Region Availability:
# Verify instance types are available in your region
aws ec2 describe-instance-type-offerings --location-type availability-zone --filters Name=instance-type,Values=g5.xlarge,inf2.xlarge
2. EKS Cluster Creation Issues
Symptoms:
- EKS cluster fails to create or becomes stuck in "CREATING" state
- Node groups fail to join the cluster
Diagnostic Steps:
# Check cluster status
aws eks describe-cluster --name inference-cluster --region us-west-2
Common Solutions:
- Ensure VPC has sufficient IP addresses across 4 availability zones
- Verify NAT Gateway creation in public subnets
- Check security group configurations allow required EKS communication
Node and Pod Issues
3. Pods Stuck in Pending State
Symptoms:
- Inference workloads remain in "Pending" status
- Karpenter not provisioning nodes
Diagnostic Commands:
# Check pod events and resource requests
kubectl describe pod <pod-name> -n <namespace>

# Check Karpenter logs
kubectl logs -n karpenter deployment/karpenter

# Check available nodes and their capacity
kubectl get nodes -o wide
kubectl describe nodes
Common Causes & Solutions:
Insufficient GPU/Neuron Quotas:
# Verify Karpenter NodePool configurations
kubectl get nodepool -o yaml
4. GPU Detection and Device Plugin Issues
Symptoms:
- GPU nodes show 0 allocatable GPUs
- NVIDIA device plugin not running
Diagnostic Steps:
# Verify GPU visibility on nodes
kubectl get nodes -o json | jq '.items[] | {name: .metadata.name, gpus: .status.allocatable["nvidia.com/gpu"]}'

# Check node labels
kubectl get nodes --show-labels | grep gpu
Solutions:
# Restart NVIDIA device plugin if needed
kubectl delete pods -n nvidia-device-plugin -l app.kubernetes.io/name=nvidia-device-plugin
5. AWS Neuron Setup Issues
Symptoms:
- Neuron devices not detected on inf2/trn1 instances
- Neuron device plugin failing
Diagnostic Commands:
# Check Neuron device plugin
kubectl get pods -n kube-system | grep neuron

# Verify Neuron devices
kubectl get nodes -o json | jq '.items[] | {name: .metadata.name, neuron: .status.allocatable["aws.amazon.com/neuron"]}'

# Check Neuron scheduler
kubectl get pods -n kube-system | grep my-scheduler
Solutions:
# Verify Neuron runtime installation
kubectl describe node <inf2-node> | grep neuron

# Check Neuron device plugin logs
kubectl logs -n kube-system <neuron-device-plugin-pod>
Model Deployment Issues
6. Model Download Failures
Symptoms:
- Pods fail to start with image pull or model download errors
- Hugging Face authentication failures
Diagnostic Steps:
# Check pod logs for download errors
kubectl logs <pod-name> -n <namespace>

# Verify Hugging Face token secret
kubectl get secret hf-token -o yaml
kubectl get secret hf-token -o jsonpath='{.data.token}' | base64 -d
Solutions:
# Recreate Hugging Face token secret
kubectl delete secret hf-token
kubectl create secret generic hf-token --from-literal=token=<your-hf-token>

# Check internet connectivity from pods
kubectl run test-pod --image=curlimages/curl -it --rm -- curl -I https://huggingface.co
7. Out of Memory (OOM) Issues
Symptoms:
- Pods getting killed with OOMKilled status
- Models failing to load completely
Diagnostic Commands:
# Check pod resource usage
kubectl top pods -n <namespace>

# Check node memory usage
kubectl top nodes

# Review pod events for OOM kills
kubectl get events --field-selector reason=OOMKilling
Solutions:
# Increase instance type to get larger GPU
# Consider using larger instance types or model sharding
Networking and Load Balancer Issues
8. Service Connectivity Problems
Symptoms:
- Cannot access inference endpoints
- Load balancer not provisioning
Diagnostic Steps:
# Check service status
kubectl get svc -A

# Check AWS Load Balancer Controller
kubectl logs -n kube-system deployment/aws-load-balancer-controller

# Verify security groups and NACLs
aws ec2 describe-security-groups --filters "Name=group-name,Values=*inference-cluster*"
Solutions:
# Restart AWS Load Balancer Controller
kubectl rollout restart deployment/aws-load-balancer-controller -n kube-system

# Check ingress annotations and configurations
kubectl describe ingress <ingress-name>
Monitoring and Observability Issues
9. Prometheus/Grafana Not Working
Symptoms:
- Monitoring dashboards not accessible
- Metrics not being collected
Diagnostic Commands:
# Check monitoring stack pods
kubectl get pods -n monitoring

# Check Prometheus targets
kubectl port-forward -n monitoring svc/kube-prometheus-stack-prometheus 9090:9090
# Navigate to http://localhost:9090/targets

# Check Grafana access
kubectl port-forward -n monitoring svc/kube-prometheus-stack-grafana 3000:80
# Navigate to http://localhost:3000
Solutions:
# Restart monitoring components
kubectl rollout restart deployment/kube-prometheus-stack-grafana -n monitoring

# Check service monitors
kubectl get servicemonitor -A
Performance and Scaling Issues
10. Slow Model Inference
Symptoms:
- High latency in model responses
- Poor throughput performance
Diagnostic Steps:
# Check resource utilization
kubectl top pods -n <namespace> --containers

# Monitor GPU utilization (if using GPUs)
kubectl exec -it <pod-name> -- nvidia-smi
Solutions:
- Verify model is using appropriate hardware acceleration
- Check if multiple models are competing for resources
- Optimize model parameters for latency
- Scale up model and use load balancing
General Debugging Commands
# Get cluster information
kubectl cluster-info
kubectl get nodes -o wide

# Check all system pods
kubectl get pods -A | grep -v Running

# View recent events
kubectl get events --sort-by='.lastTimestamp' -A

# Check Karpenter provisioning
kubectl logs -n karpenter deployment/karpenter --tail=100

# Verify EKS add-ons
aws eks describe-addon --cluster-name inference-cluster --addon-name vpc-cni
Getting Additional Help
If you continue to experience issues:
- Check AWS Service Health: Visit the AWS Service Health Dashboard
- Review CloudWatch Logs: Check EKS control plane logs in CloudWatch
- Consult Documentation: Refer to the EKS Troubleshooting Guide
- Community Support: Post questions in the AI on EKS GitHub Issues