指标仪表板
指标仪表板
指标仪表板以图表的方式展现指定时间内CloudFront的相关指标。仪表板通过分析CloudFront标准日志或实时日志用于生成指标。如果您只需要通过RESTful API获取CloudFront性能数据,而不需要仪表板,本解决方案也提供了一个指标API供您调用。
使用指标仪表板,您可以执行以下操作:
-
查看图形化指标
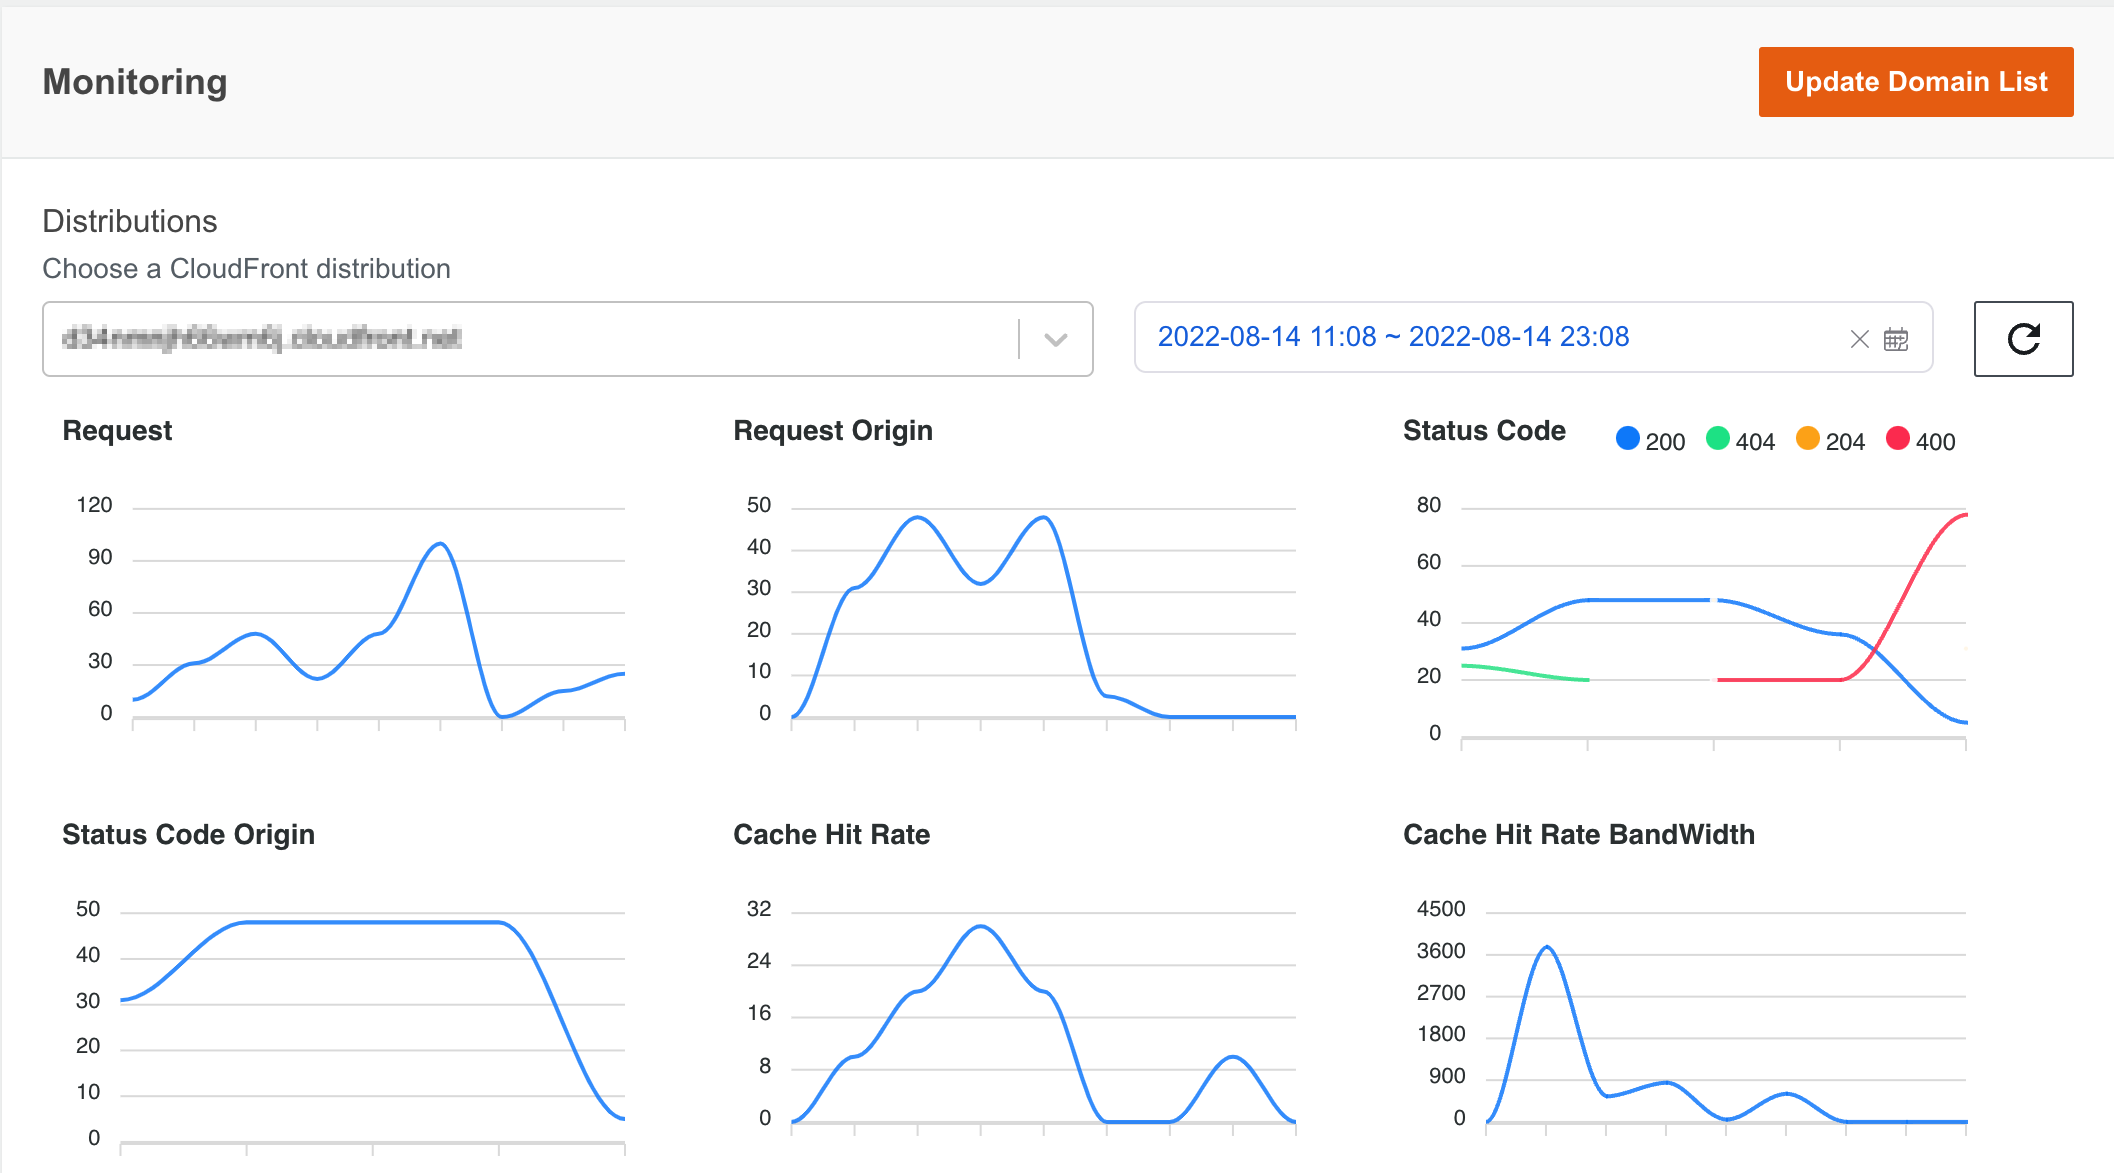
CloudFront监控仪表板显示了多个监控指标。每个图表都与CloudFront监控API中的指标一一对应。
说明
仪表板中的指标类型与部署解决方案后的CloudFront监控API获取类型相同。
请参见下面列表中的指标描述
CloudFront监控API类型 描述 指标采集时间间隔 实时流量指标 通过分析CloudFront实时日志,延迟5分钟 5分钟 非实时流量指标 通过分析CloudFront标准日志,延迟1小时 5分钟 指标定义:
指标 描述 查询指标的示例SQL Requests 从客户端到 CloudFront 的请求数量 SELECT count(timestamp), cast(avg("time-taken") as decimal(38,3)), "cs-host", "c-country" FROM "db"."cf_log" WHERE year = 2023 AND month = 1 AND day = 4 AND hour = 6 AND timestamp <= 1672813380.0 AND timestamp > 1672813320.0 group by "cs-host", "c-country"; Origin requests 回源的请求数量 SELECT count(timestamp), cast(avg("time-taken") as decimal(38,3)), "cs-host", "c-country" FROM "db"."cf_log" WHERE year = 2023 AND month = 1 AND day = 4 AND hour = 6 AND timestamp <= 1672813620.0 AND timestamp > 1672813560.0 AND ("x-edge-detailed-result-type" = 'Miss' OR ("x-edge-detailed-result-type" like '%Origin%' AND "x-edge-detailed-result-type" <> 'OriginShieldHit')) group by "cs-host", "c-country"; Requests latency 从客户端到 CloudFront 的请求时延 SELECT count(timestamp), cast(avg("time-taken") as decimal(38,3)), "cs-host", "c-country" FROM "db"."cf_log" WHERE year = 2023 AND month = 1 AND day = 4 AND hour = 6 AND timestamp <= 1672813380.0 AND timestamp > 1672813320.0 group by "cs-host", "c-country"; Origin requests latency 回源请求时延 SELECT count(timestamp), cast(avg("time-taken") as decimal(38,3)), "cs-host", "c-country" FROM "db"."cf_log" WHERE year = 2023 AND month = 1 AND day = 4 AND hour = 6 AND timestamp <= 1672813620.0 AND timestamp > 1672813560.0 AND ("x-edge-detailed-result-type" = 'Miss' OR ("x-edge-detailed-result-type" like '%Origin%' AND "x-edge-detailed-result-type" <> 'OriginShieldHit')) group by "cs-host", "c-country"; Requests 3xx/4xx/5xx error rate 从客户端到 CloudFront 的3xx/4xx/5xx状态码比例 SELECT "sc-status", count(timestamp), cast(avg("time-taken") as decimal(38,3)), "cs-host", "c-country" FROM "db"."cf_log" WHERE year = 2023 AND month = 1 AND day = 4 AND hour = 6 AND timestamp <= 1672815240.0 AND timestamp > 1672815180.0 GROUP BY "sc-status", "cs-host", "c-country"; Origin requests 3xx/4xx/5xx error rate 回源的3xx/4xx/5xx状态码比例 SELECT "sc-status", count(timestamp), cast(avg("time-taken") as decimal(38,3)), "cs-host", "c-country" FROM "db"."cf_log" WHERE year = 2023 AND month = 1 AND day = 4 AND hour = 6 AND timestamp <= 1672815360.0 AND timestamp > 1672815300.0 AND ("x-edge-detailed-result-type" = 'Miss' OR ("x-edge-detailed-result-type" like '%Origin%' AND "x-edge-detailed-result-type" <> 'OriginShieldHit')) group by "sc-status", "cs-host", "c-country"; Requests 3xx/4xx/5xx error latency 从客户端到 CloudFront 的3xx/4xx/5xx状态码的时延 SELECT "sc-status", count(timestamp), cast(avg("time-taken") as decimal(38,3)), "cs-host", "c-country" FROM "db"."cf_log" WHERE year = 2023 AND month = 1 AND day = 4 AND hour = 6 AND timestamp <= 1672815240.0 AND timestamp > 1672815180.0 GROUP BY "sc-status", "cs-host", "c-country"; Origin requests 3xx/4xx/5xx error latency 回源3xx/4xx/5xx状态码的时延 SELECT "sc-status", count(timestamp), cast(avg("time-taken") as decimal(38,3)), "cs-host", "c-country" FROM "db"."cf_log" WHERE year = 2023 AND month = 1 AND day = 4 AND hour = 6 AND timestamp <= 1672815360.0 AND timestamp > 1672815300.0 AND ("x-edge-detailed-result-type" = 'Miss' OR ("x-edge-detailed-result-type" like '%Origin%' AND "x-edge-detailed-result-type" <> 'OriginShieldHit')) group by "sc-status", "cs-host", "c-country"; Requests latency (300-1000+ms) rate 时延300ms至1s以上各阶段比例 SELECT cast((sum(case when "time-taken" >= 1.0 then 1 else 0 end) * 100.0 / count(*)) as decimal(38,2)) as ratio, count(timestamp), "cs-host", "c-country" FROM "db"."cf_log" WHERE year = 2023 AND month = 1 AND day = 4 AND hour = 7 AND timestamp <= 1672815720.0 AND timestamp > 1672815660.0 group by "cs-host", "c-country"; Top 10 URLs with most requests 根据请求数量统计的前10个URL SELECT b.* from (SELECT "cs-host", "cs-uri-stem", cnt, row_number() over (partition by "cs-host", "cs-uri-stem" order by cnt desc) rank from (select "cs-host", "cs-uri-stem", count(1) as cnt from "db"."cf_log" where year = 2023 AND month = 1 AND day = 3 AND timestamp <= 1672790399.0 AND timestamp > 1672704000.0 group by "cs-host", "cs-uri-stem") a) b where b.rank <= 100 order by "cs-host", "cnt" desc; Bandwidth 从客户端到CloudFront的带宽 SELECT sum("sc-bytes")/(601)8, "cs-host", "c-country" FROM "db"."cf_log" WHERE year = 2023 AND month = 1 AND day = 4 AND hour = 6 AND timestamp <= 1672813620.0 AND timestamp > 1672813560.0 group by "cs-host", "c-country"; Origin bandwidth 回源的带宽 SELECT sum("sc-bytes")/(601)8, "cs-host", "c-country" FROM "db"."cf_log" WHERE year = 2023 AND month = 1 AND day = 4 AND hour = 7 AND timestamp <= 1672815900.0 AND timestamp > 1672815840.0 AND ("x-edge-detailed-result-type" = 'Miss' OR ("x-edge-detailed-result-type" like '%Origin%' AND "x-edge-detailed-result-type" <> 'OriginShieldHit')) group by "cs-host", "c-country"; Data transfer 响应流量 SELECT sum("sc-bytes"), "cs-host", "c-country" FROM "db"."cf_log" WHERE year = 2023 AND month = 1 AND day = 4 AND hour = 7 AND timestamp <= 1672816260.0 AND timestamp > 1672816200.0 group by "cs-host", "c-country"; Top 10 URLs with most traffic 根据流量统计的前10个URL SELECT b.* from (SELECT "cs-host", "cs-uri-stem", sc_size, row_number() over (partition by "cs-host", "cs-uri-stem" order by sc_size desc) rank from (select "cs-host", "cs-uri-stem", sum("sc-bytes") as sc_size from "db"."cf_log" where year = 2023 AND month = 1 AND day = 3 AND timestamp <= 1672790399.0 AND timestamp > 1672704000.0 group by "cs-host", "cs-uri-stem") a) b where b.rank <= 100 order by "cs-host", "sc_size" desc; Cache hit rate (calculated using requests) 通过请求数量计算的缓存命中率 SELECT cast((sum(case when "x-edge-result-type" like '%Hit' then 1 else 0 end) * 100.0 / count(1)) as decimal(38,2)) as ratio, count(timestamp), "cs-host", "c-country" FROM "db"."cf_log" WHERE year = 2023 AND month = 1 AND day = 4 AND hour = 7 AND timestamp <= 1672816680.0 AND timestamp > 1672816620.0 AND "x-edge-response-result-type" <> 'LimitExceeded' AND "x-edge-response-result-type" <> 'CapacityExceeded' group by "cs-host", "c-country"; Cache hit rate (calculated using bandwidth) 通过带宽计算的缓存命中率 SELECT cast((sum(case when "x-edge-result-type" like '%Hit' then "sc-bytes" else 0 end)100.0/(605)8) / (sum("sc-bytes")/(605)*8 ) as decimal(38,2)) as ratio, count(timestamp), "cs-host", "c-country" FROM "db"."cf_log" WHERE year = 2023 AND month = 1 AND day = 4 AND hour = 6 AND timestamp <= 1672813320.0 AND timestamp > 1672813260.0 AND "x-edge-response-result-type" <> 'LimitExceeded' AND "x-edge-response-result-type" <> 'CapacityExceeded' group by "cs-host", "c-country"; Cache result 各种x-edge-result-type的请求数量,例如命中缓存的请求数量、未命中缓存的请求数量 SELECT "x-edge-result-type", count(timestamp), cast(avg("time-taken") as decimal(38,3)), "cs-host", "c-country" FROM "db"."cf_log" WHERE year = 2023 AND month = 1 AND day = 4 AND hour = 7 AND timestamp <= 1672816980.0 AND timestamp > 1672816920.0 group by "x-edge-result-type", "cs-host", "c-country"; Cache result latency 各种x-edge-result-type的请求时延,例如命中缓存的请求时延、未命中缓存的请求时延 SELECT "x-edge-result-type", count(timestamp), cast(avg("time-taken") as decimal(38,3)), "cs-host", "c-country" FROM "db"."cf_log" WHERE year = 2023 AND month = 1 AND day = 4 AND hour = 7 AND timestamp <= 1672816980.0 AND timestamp > 1672816920.0 group by "x-edge-result-type", "cs-host", "c-country"; 您可以从Web控制台左侧栏导航找到CloudFront监控仪表板,然后选择要在图表中查看的CloudFront分配(您可以通过CNAMEs找到),并在时间选择器中指定一个监控时间段。最后,流量指标将显示在仪表板的图表中。
-
配置待监控域名
CloudFront分配列表包括所有需要监控的CloudFront分配,此列表可在部署本解决方案的时,在CloudFormation参数中配置,详情请参阅部署解决方案。部署CloudFormation堆栈后,您可以在指标仪表板中设置/更新监控域名列表。
说明
如果在CloudFormation部署参数中填入“ALL”来监视AWS帐户中的所有域名,那么更新域名列表后,只会监控更新后的域名。
- 登录到web控制台。
- 在左侧边栏的“监控”下,选择CloudFront流量。
- 单击“更新域名列表”打开配置窗口。
- 在弹出窗口中,选择要添加到监控列表中的CloudFront分配。
- 选择应用。
当域列表更改后,仪表板中的分配列表将相应更新,指标将在大约5分钟后显示在图表中。