Amazon CloudWatch Container Insights (EKS only)
CloudWatch Container Insights can be used to collect, aggregate, and summarize metrics and logs from your containerized applications and microservices. Container Insights is available for Amazon Elastic Kubernetes Service (Amazon EKS) and helps collect metrics from cluster deployed on EKS.
The metrics that Container Insights collects are available in CloudWatch automatic dashboards. You can analyze and troubleshoot container performance and logs data with CloudWatch Logs Insights.
In Amazon EKS and Kubernetes, Container Insights uses a containerized version of the CloudWatch agent to discover all of the running containers in a cluster. It then collects performance data at every layer of the performance stack.
Setup Environment Variables
First, ensure that you have sourced all the environment variables such as EXECUTION_ROLE, EKS_CLUSTER_NAME
Setup Container insights
Below are the steps required to setup Container insights
- Verify the HyperPod execution role has CloudWatchAgentServerPolicy attached. If not, use the following command to attach the policy:
export EX_ROLE_NAME=$(echo $EXECUTION_ROLE | sed 's/.*\///')
aws iam attach-role-policy \
--role-name $EX_ROLE_NAME \
--policy-arn arn:aws:iam::aws:policy/CloudWatchAgentServerPolicy
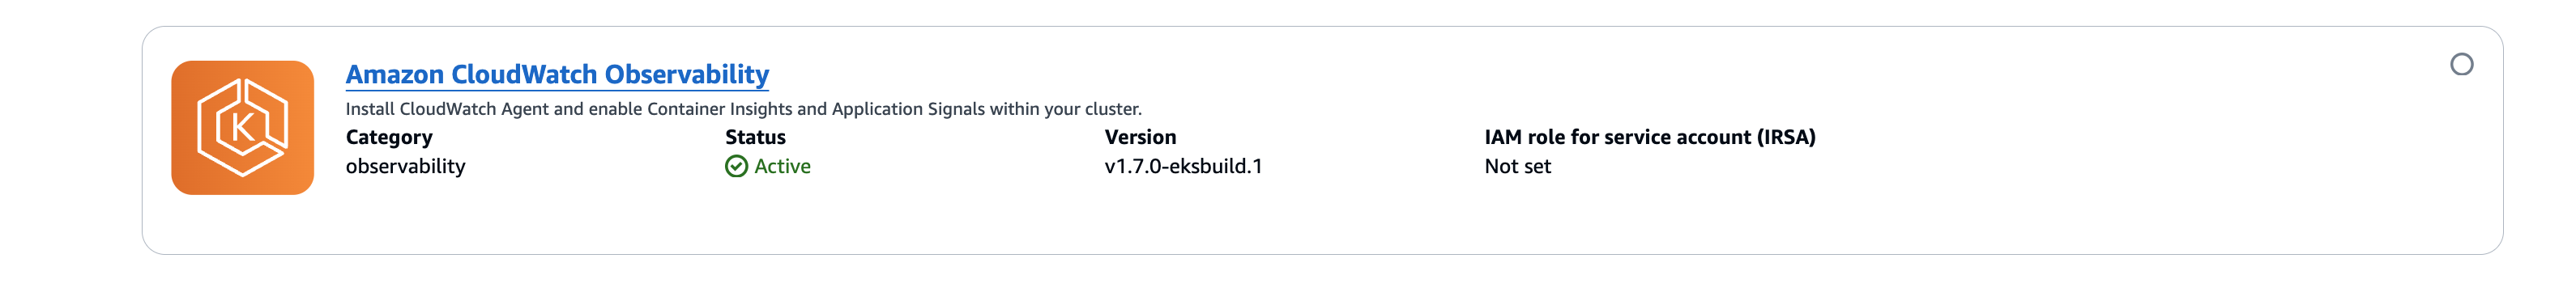
- Install the Amazon CloudWatch Observability EKS add-on.
aws eks create-addon --addon-name amazon-cloudwatch-observability --cluster-name $EKS_CLUSTER_NAME
After the installation, the Amazon CloudWatch Observability will show in EKS cluster console under the Add-ons tab with status Active as shown below
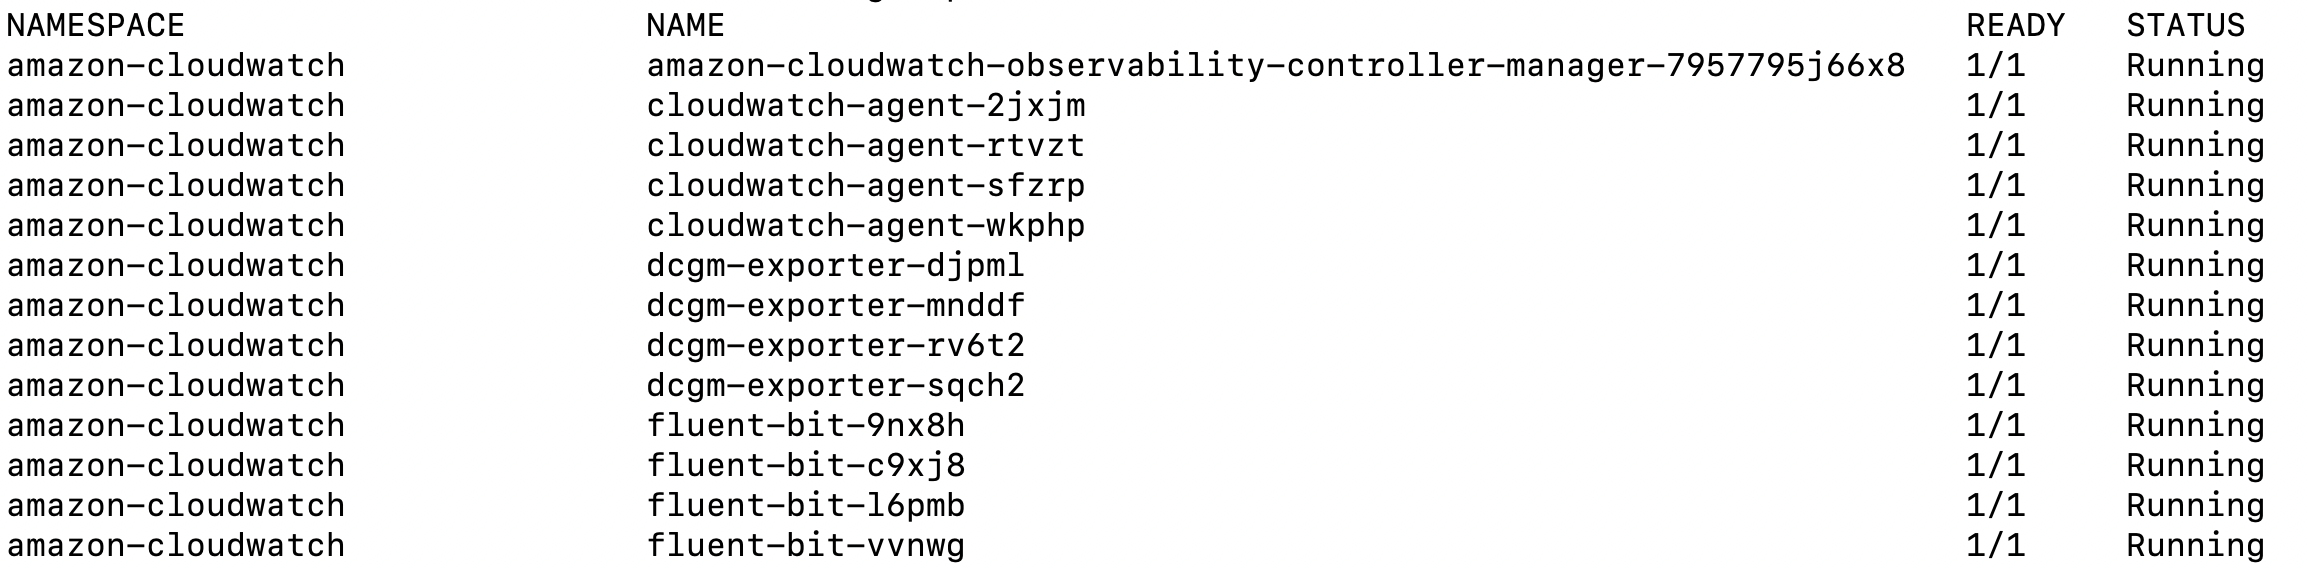
- Check if cloudwatch-agent and fluent-bit pods are running on EKS cluster under namespace amazon-cloudwatch using kubectl as shown below.
kubectl get pods -n amazon-cloudwatch
Your output should be similar to the one below.
That’s it! CloudWatch Container Insights will now be enabled for your EKS cluster. You can access the dashboard in CloudWatch console under Container Insights.
Container Insights Dashboards
Once enabled, enhanced container insights page looks like below from AWS console, with the high level summary of your clusters, kube-state and control-plane metrics. The Container Insights dashboard shows cluster status and alarms. It uses predefined thresholds for CPU and memory to quickly identify which resources are having higher consumption, and enabling proactive actions to avoid performance impact.
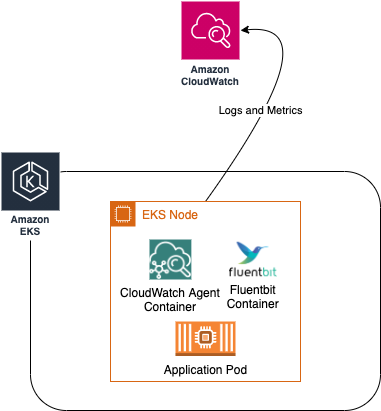
Below is the architecture diagram that shows the components that are involved in collecting logs and metrics from your EKS environment.
Using the console to check insights
Viewing cluster resources
- In the AWS Management Console on the Services menu, click CloudWatch.
- In the left navigation menu under Container Insights, Select Service: EKS.
- Scroll down to the Clusters Overview section and select
<Hyperpod cluster>from the list of clusters.
This will return the performance monitoring for the selected cluster
You should be able to see something like below
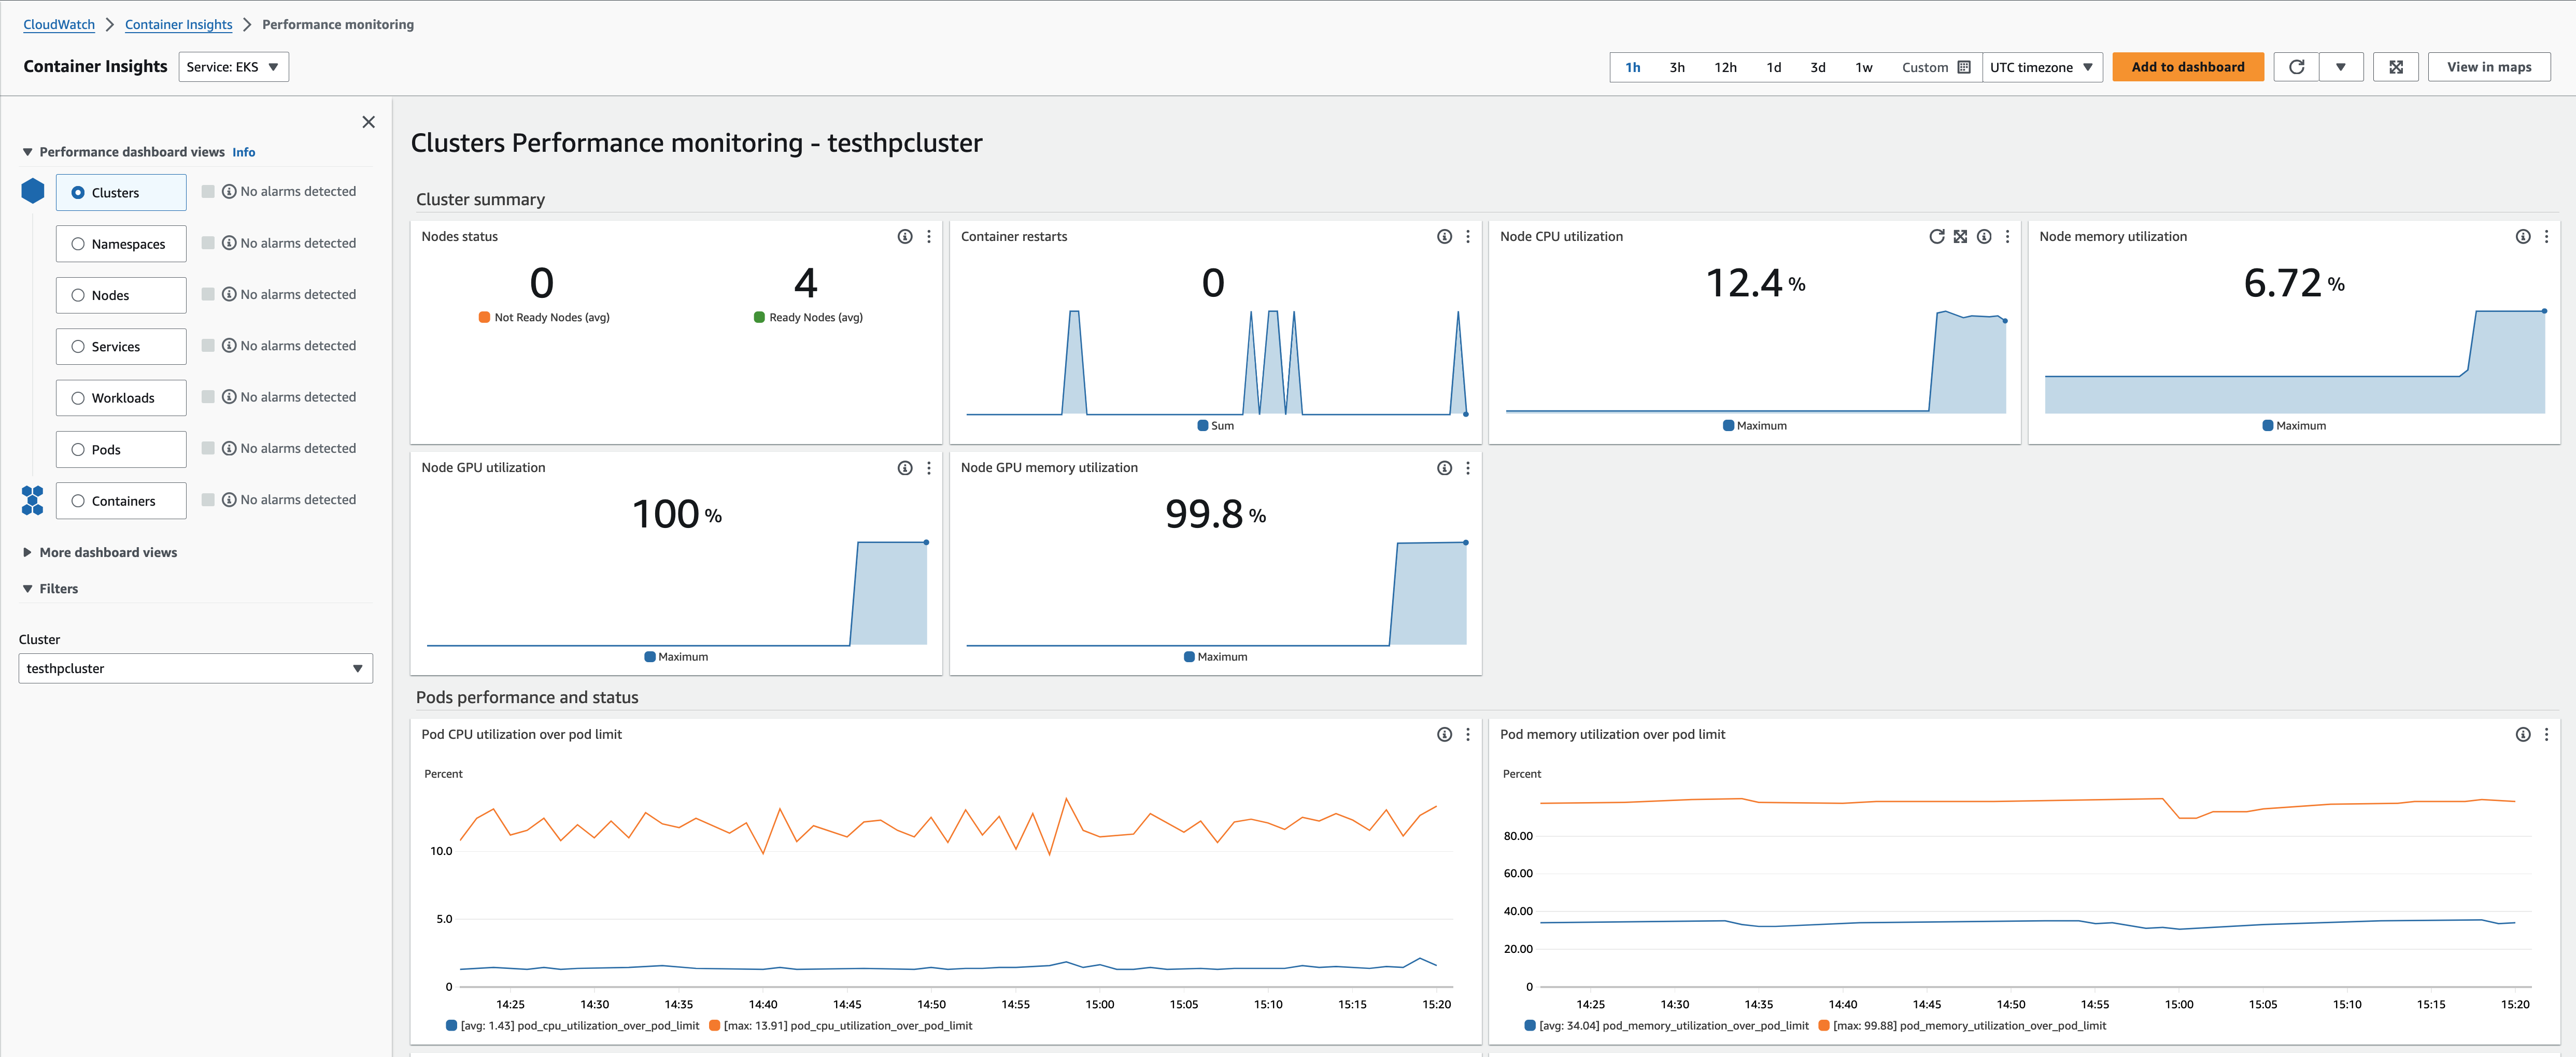
This monitoring dashboard provides various views to analyze performance, including:
- Cluster-wide performance dashboard view – Provides an overview of resource utilization across the entire cluster.
- Node performance view – Visualizes metrics at the individual node level.
- Pod performance view – Focuses on pod-level metrics for CPU, memory, network, etc.
- Container performance view – Drills down into utilization metrics for individual containers.
Here you will be able to see the automatic performance dashboards created by CloudWatch Container Insights enhanced metrics for EKS. The Amazon CloudWatch Container Insights dashboards allow you to drill down into more detailed views to gain additional insights. we could start with the cluster-wide performance dashboard to get a high-level perspective. The different views allow methodically narrowing down to find the root cause, from cluster to node to pod to container.
- Clusters
- Namespaces
- Nodes
- Services
- Workloads
- Pods
- Containers
Click on a few of the options listed above to view the different dashboards.
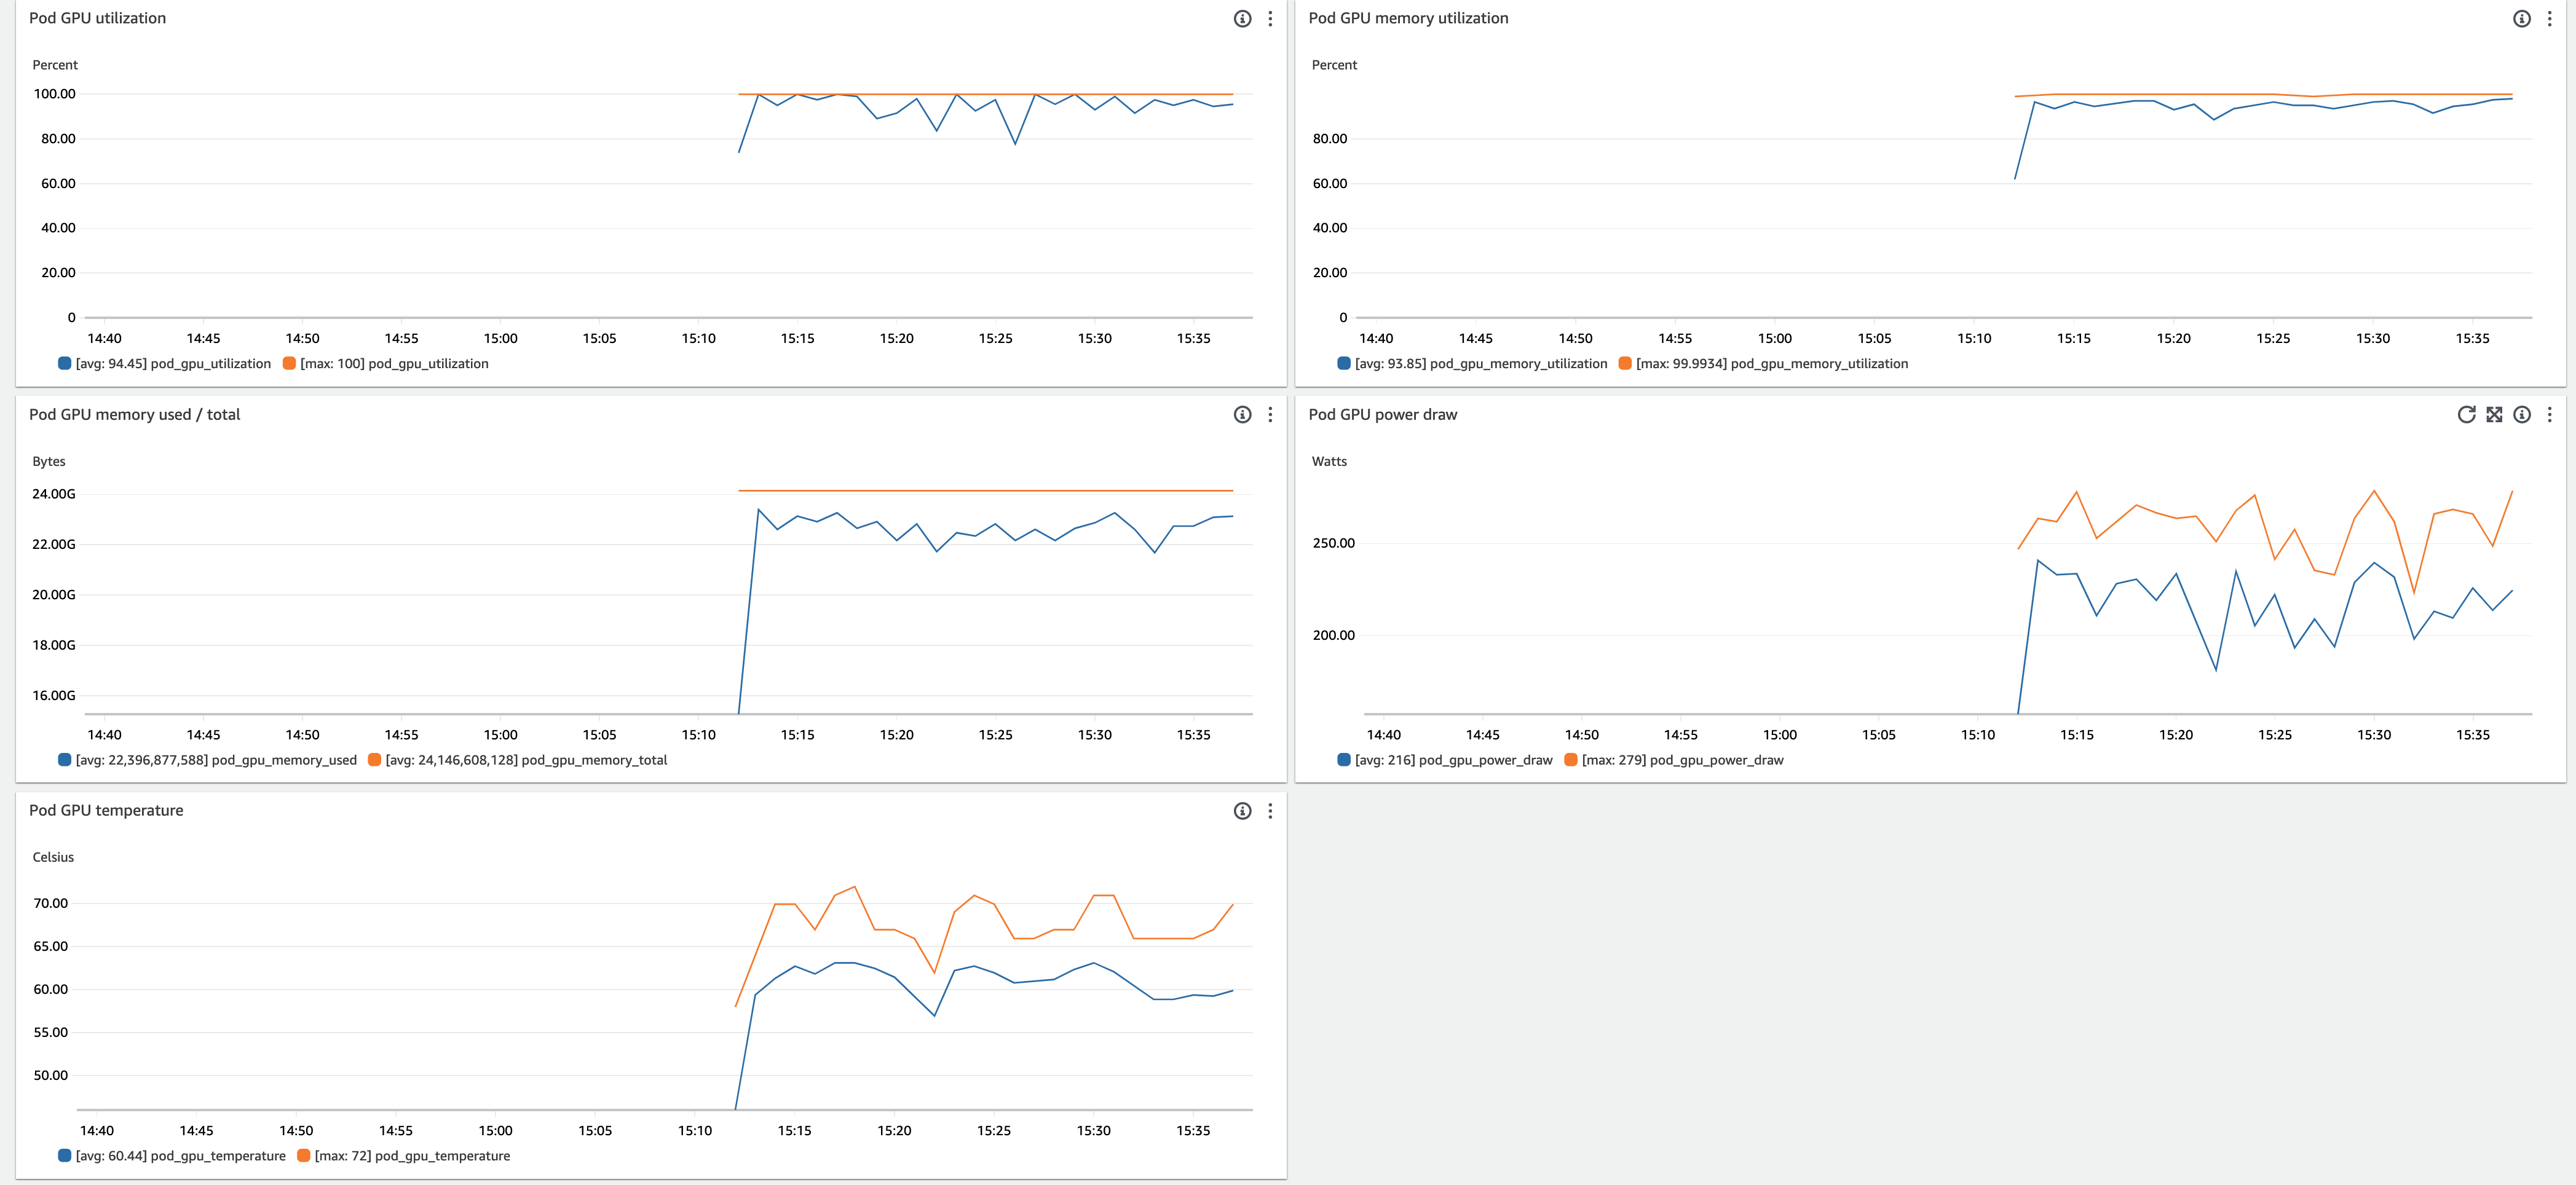
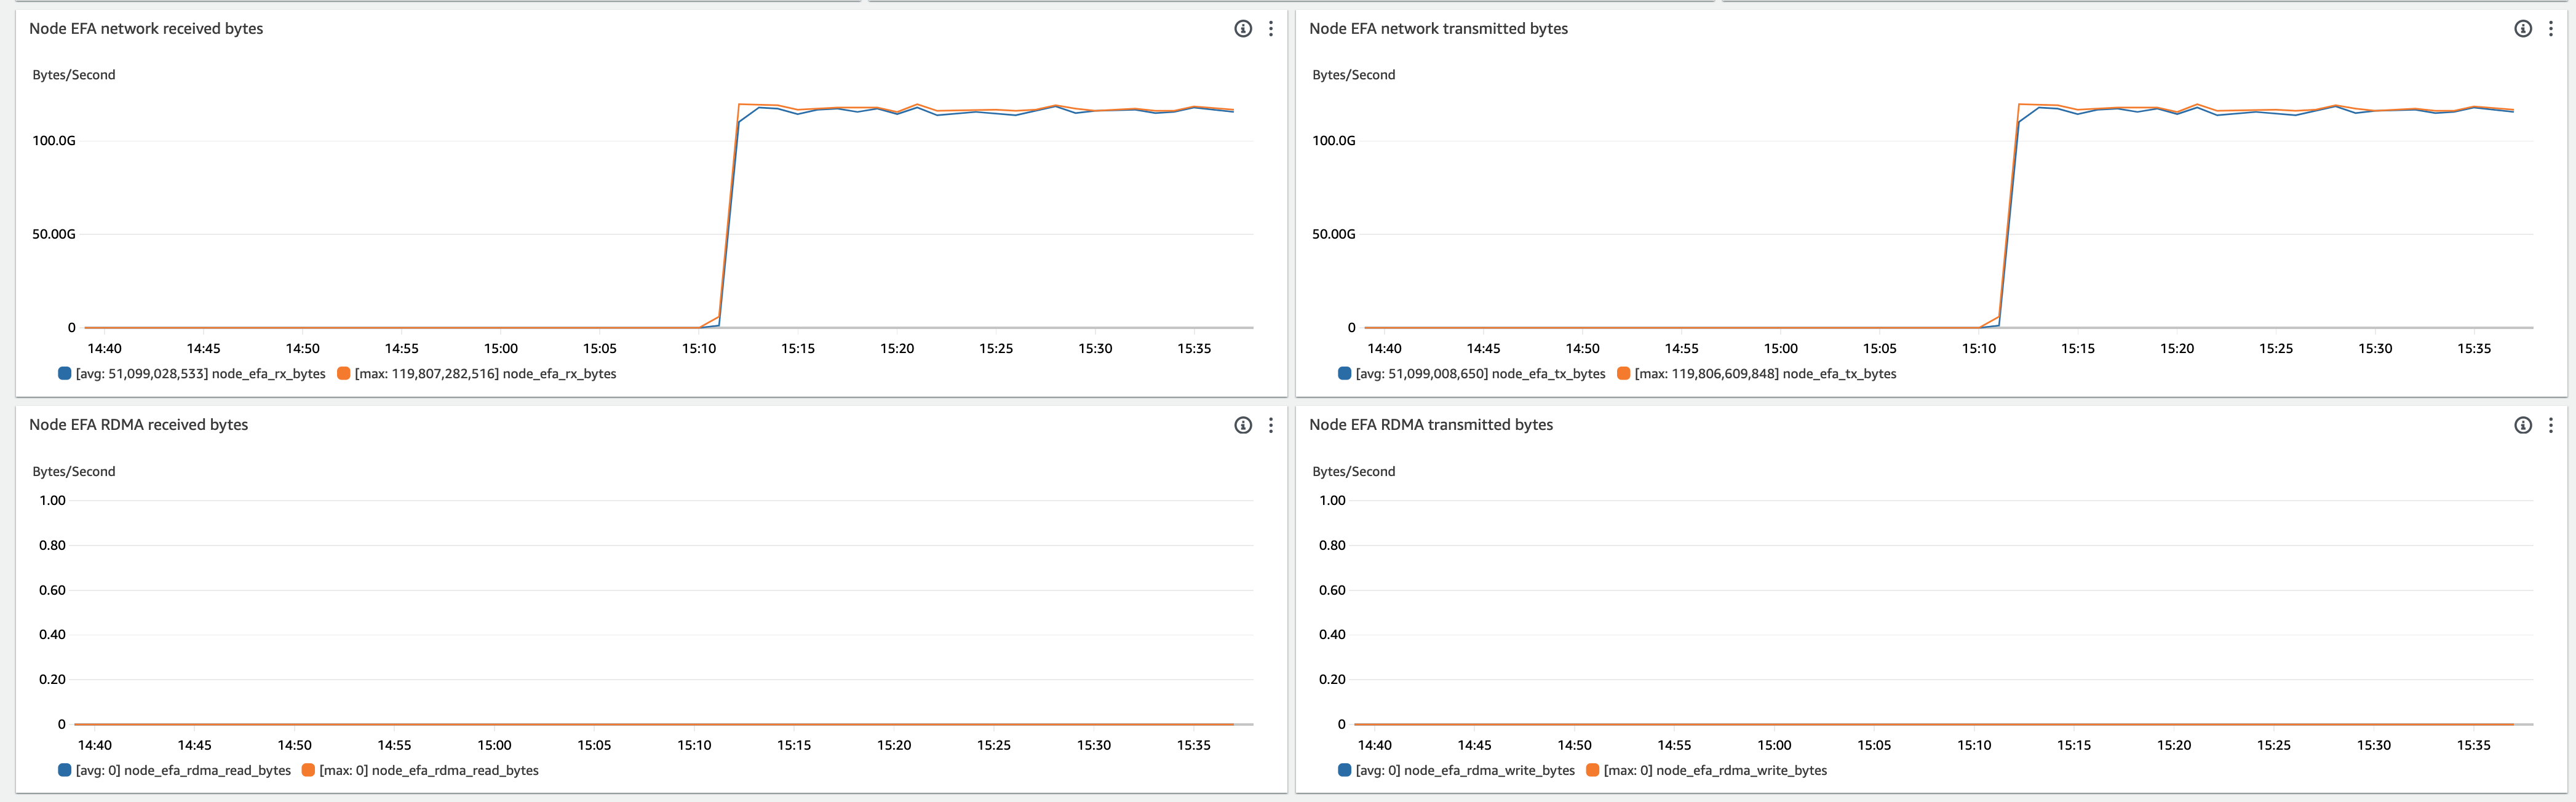
Also you can look at different graphs / metrics like GPU, EFA , CPU, Network utilizations. Below are some of the graphs that will be useful when training ML Models.
GPU Utilization and GPU Memory
We can look at both pod level and node level GPU metrics. Once you scroll on the dashboard you should be able to see something like below.
EFA metrics
Similarly we can look EFA metrics including the network and RDMA bytes recieved.
Access CloudWatch container insights logs
Go to the CloudWatch console, and log groups.
The log group named in the following format should appear. You can check performance, host, application and data plane logs.
/aws/containerinsights/<eks-cluster-name>/*