One-Click Observability with Amazon Managed Grafana and Amazon Managed Prometheus (EKS only)
Amazon SageMaker HyperPod (SageMaker HyperPod) provides a comprehensive, out-of-the-box dashboard that gives you insights into foundation model (FM) development tasks and cluster resources.
This unified observability solution automatically publishes key metrics to Amazon Managed Service for Prometheus and displays them in Amazon Managed Grafana dashboards. The dashboards are optimized specifically for FM development with deep coverage of hardware health, resource utilization, and task-level performance. With this add-on, you can consolidate health and performance data from NVIDIA DCGM, instance-level Kubernetes node exporters, Elastic Fabric Adapter, integrated file systems, Kubernetes APIs, Kueue, and SageMaker HyperPod task operators.
This section details how you can use this observability add-on with your HyperPod EKS cluster.
Prerequisites
AWS IAM Identity Center
To get started with SageMaker HyperPod observability, you first need to enable AWS IAM Identity Center to use Amazon Managed Grafana, since Amazon Managed Grafana uses IAM Identity Center to authenticate users to your dashboards. You can do this through the IAM Identity Center AWS Console.
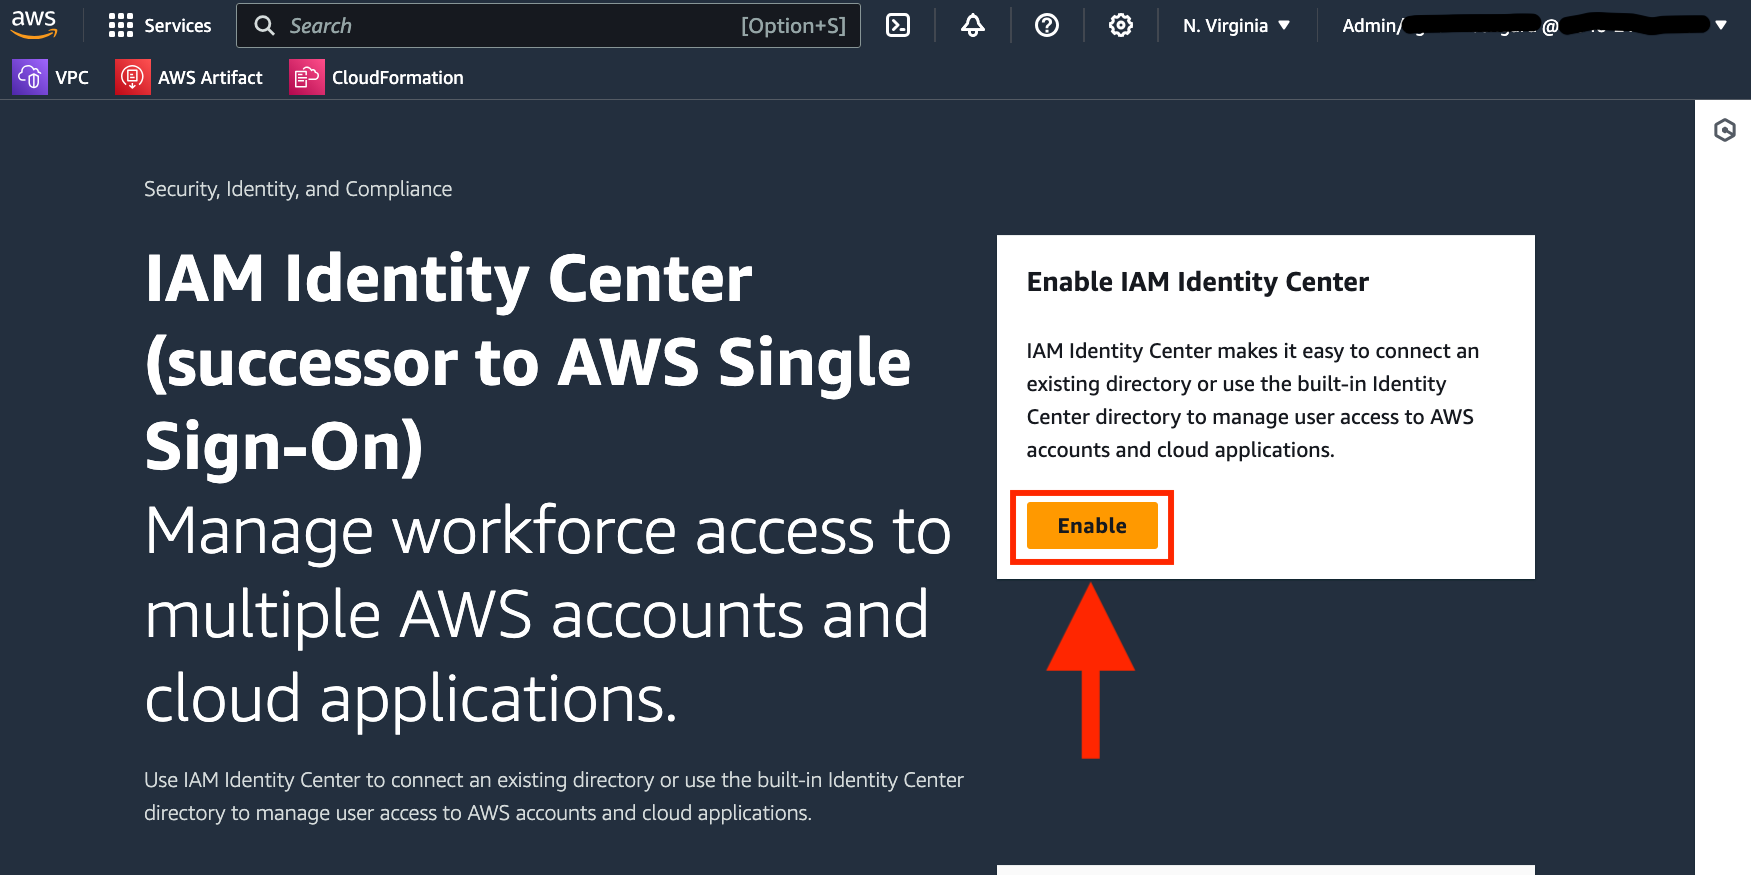
Additionally, create at least one user in the IAM Identity Center.
HyperPod Slurm Observability CloudFormation is currently pending and not yet available.
The following is for SageMaker Hyperpod EKS instructions
Have a SageMaker HyperPod EKS cluster pre-deployed!
SageMaker HyperPod observability is available for SageMaker HyperPod clusters with an Amazon EKS orchestrator. If you don’t already have a SageMaker HyperPod cluster with an Amazon EKS orchestrator, refer to the cluster setup sections (setup, cluster).
You can come back to this section once these pre-requisites are met.
[Easy Setup] Enable SageMaker HyperPod Observability
Steps
To enable SageMaker HyperPod observability, follow these steps:
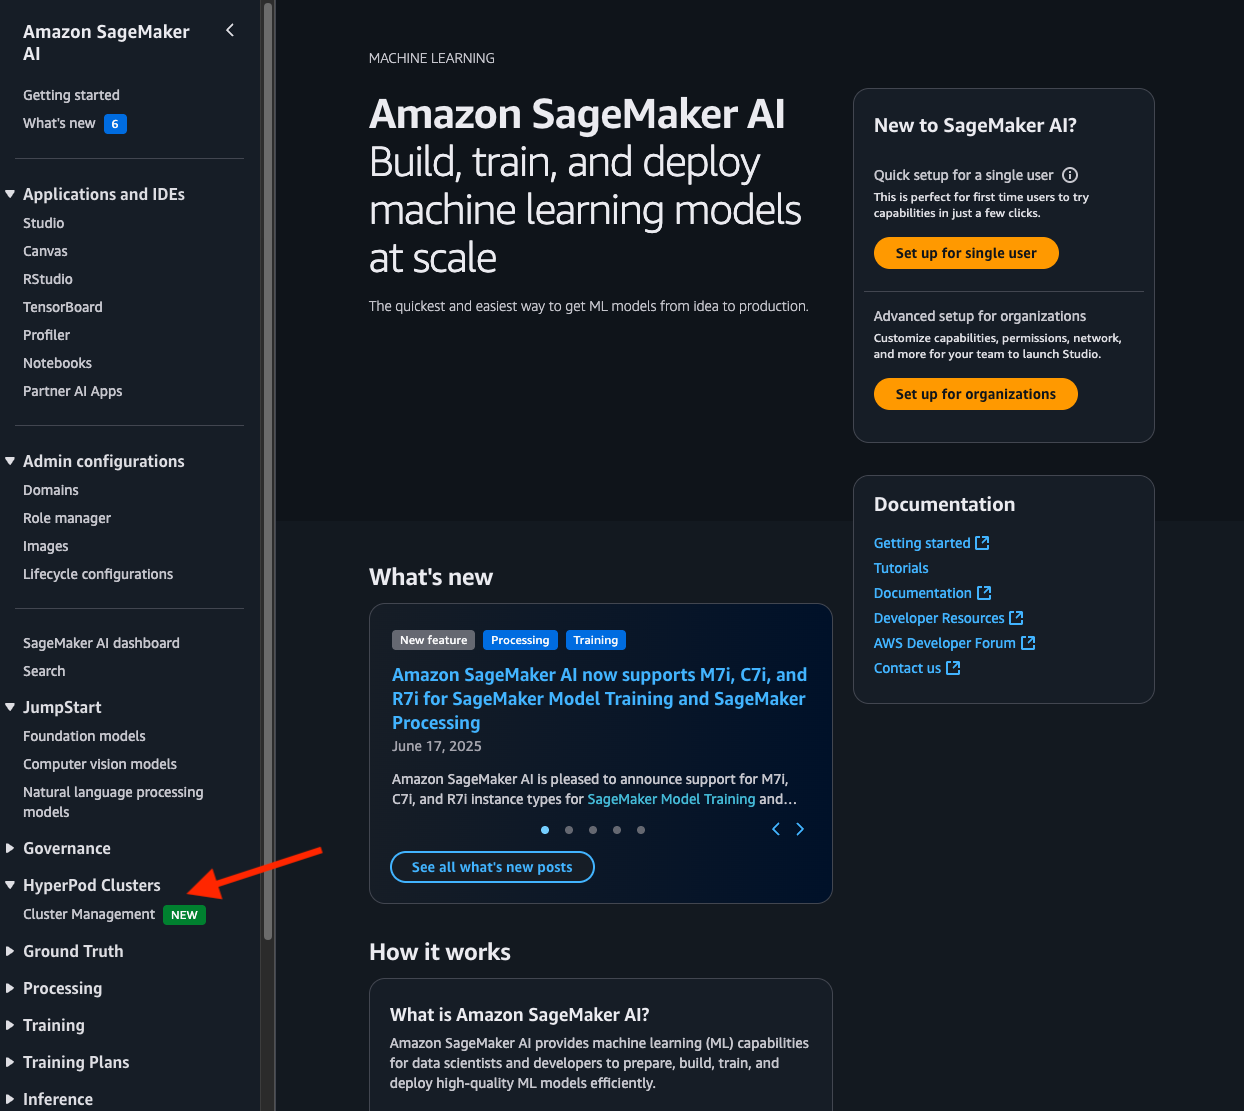
- On the SageMaker AI console, choose Cluster management (under HyperPod Clusters) in the navigation pane.
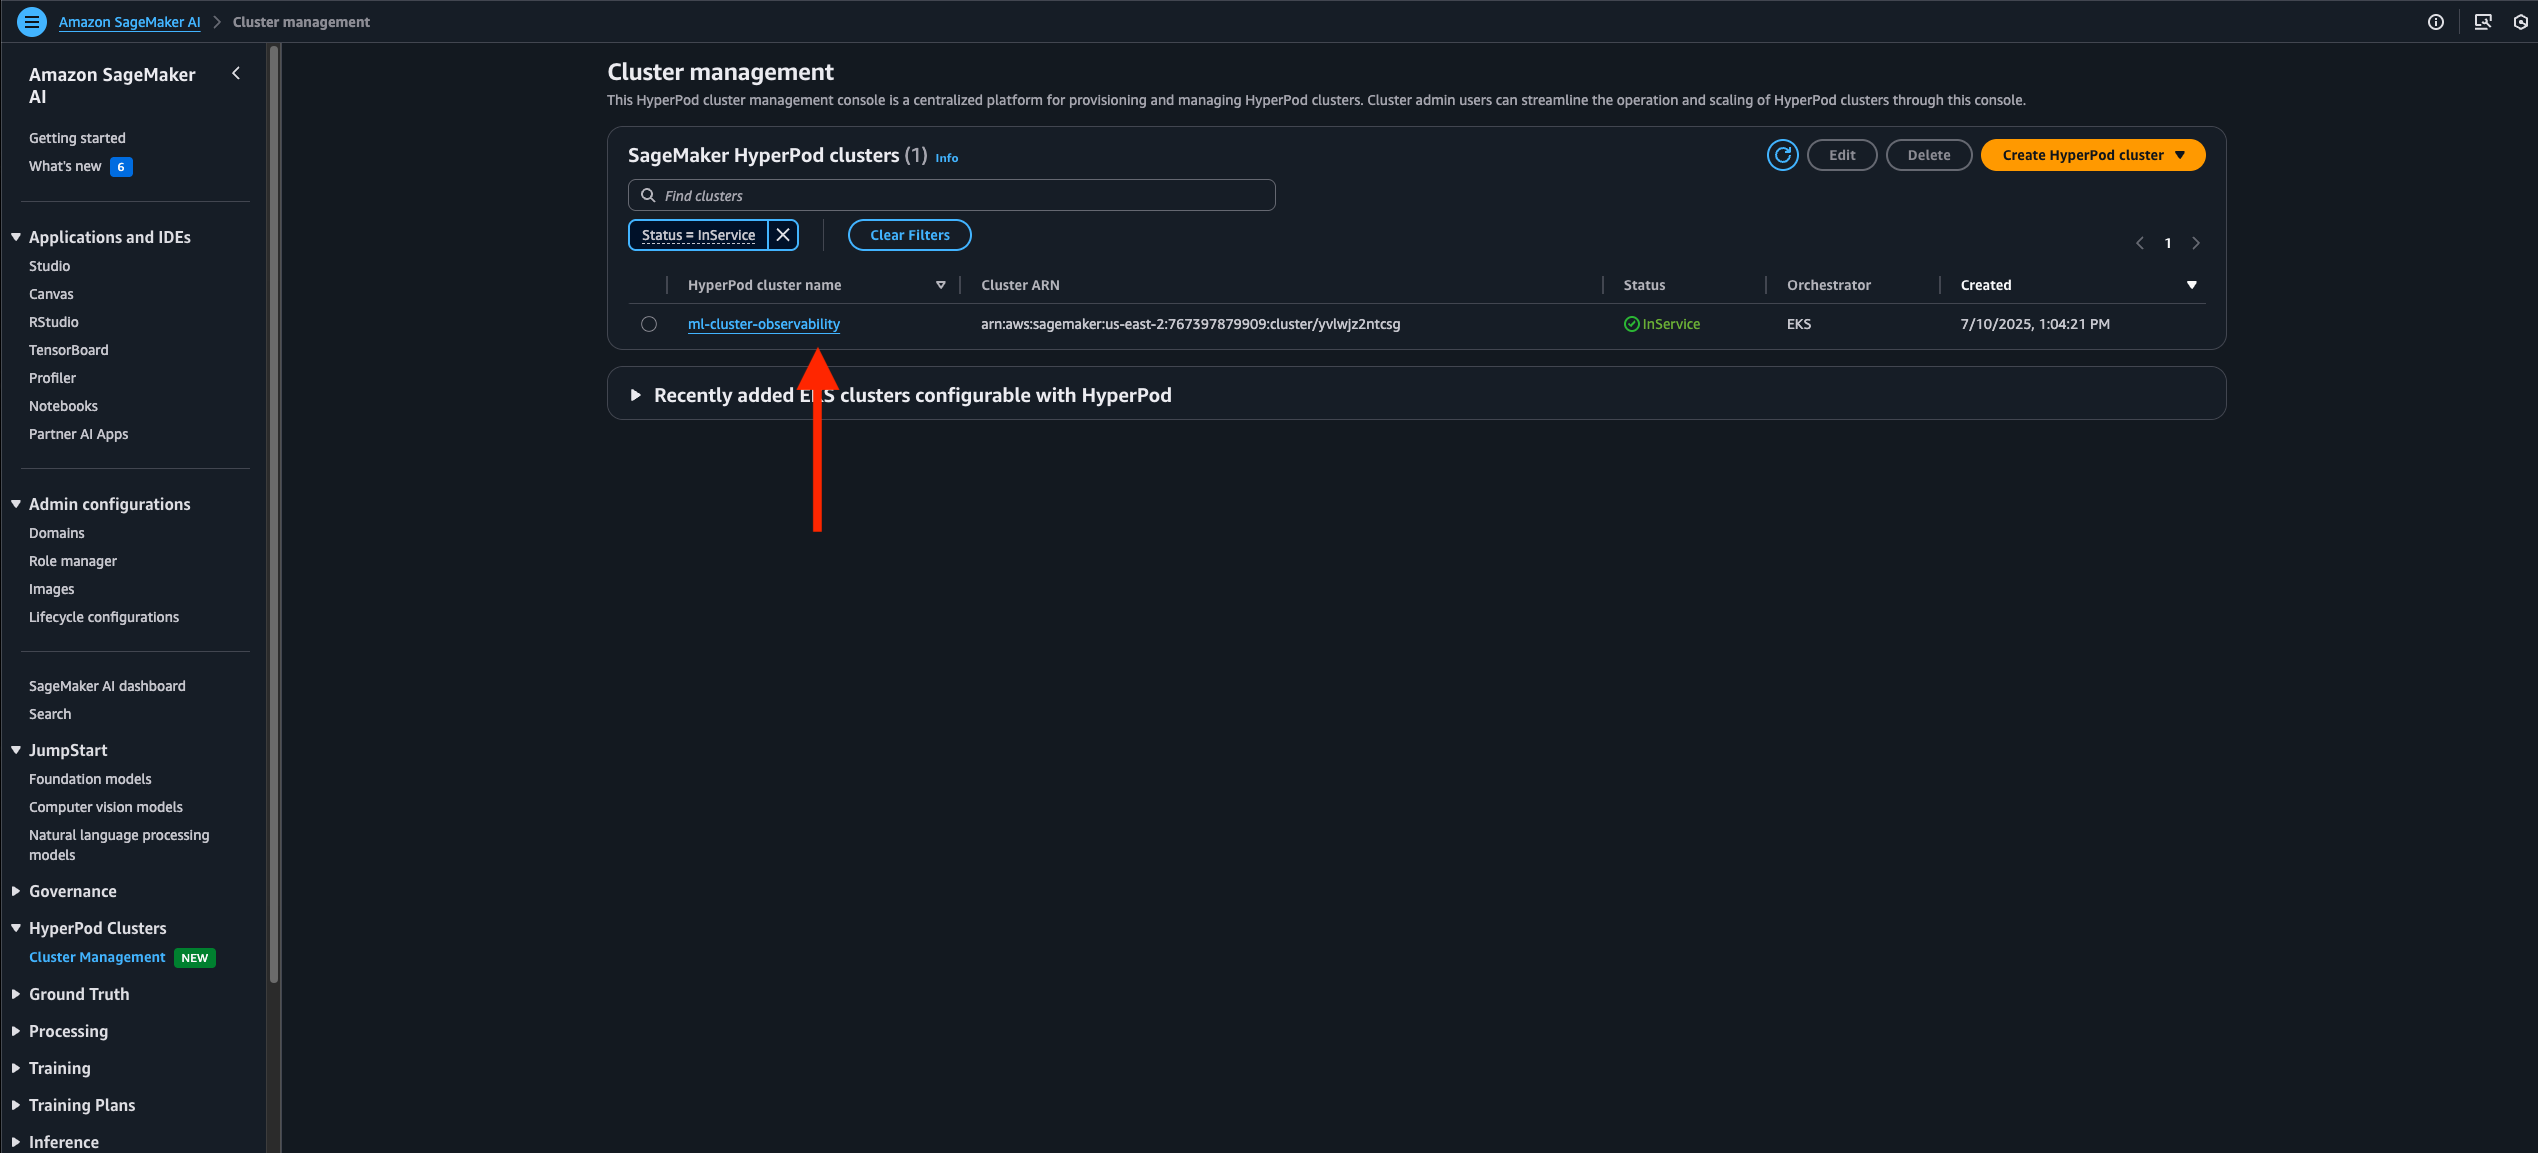
- Open the cluster detail page from the SageMaker HyperPod clusters list.
- On the Dashboard tab, in the HyperPod Observability section, choose Quick installation.
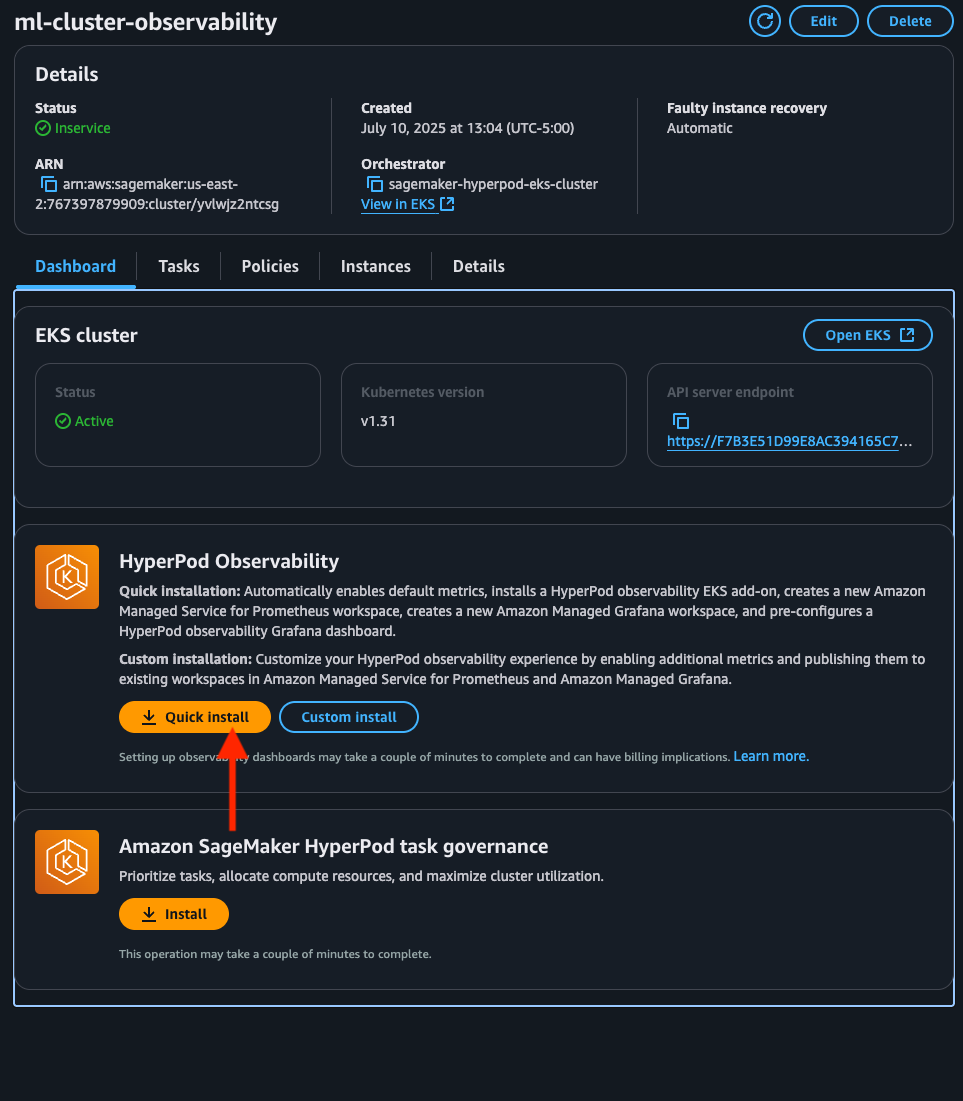
SageMaker AI will create a new Prometheus workspace, a new Grafana workspace, and install the SageMaker HyperPod observability add-on to the EKS cluster. The installation typically completes within a few minutes.
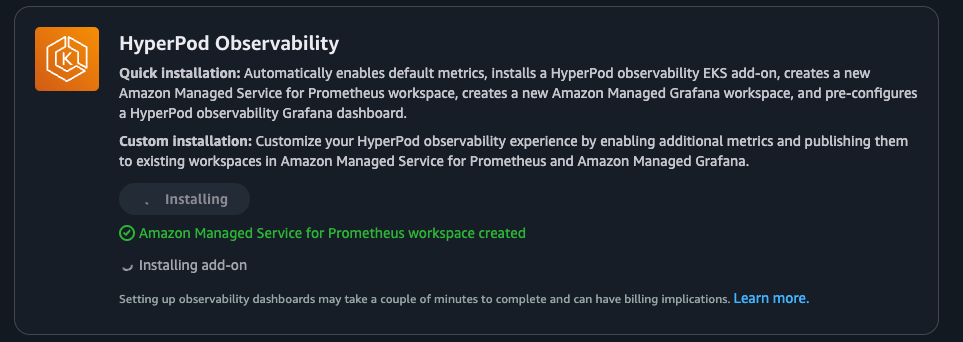
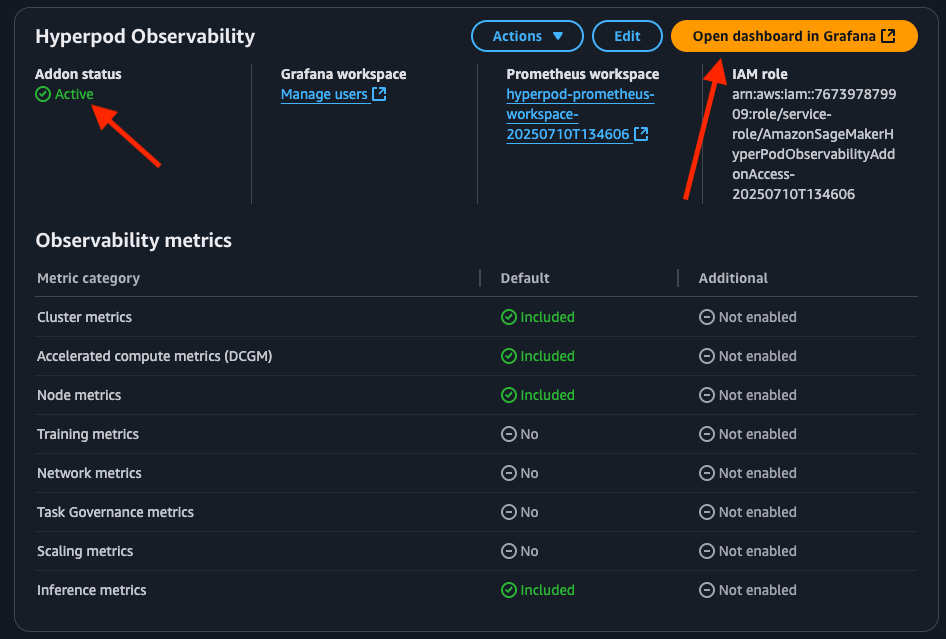
Once the installation is complete (once Addon status changes from Installing to Active), you can view the add-on details and metrics available to you (steps below).
- Hit "Open dashboard in Grafana", and when prompted, sign in with your IAM Identity Center user credentials (configured as part of prerequisites). After signing in successfully, you will see the SageMaker HyperPod observability dashboard on Grafana.
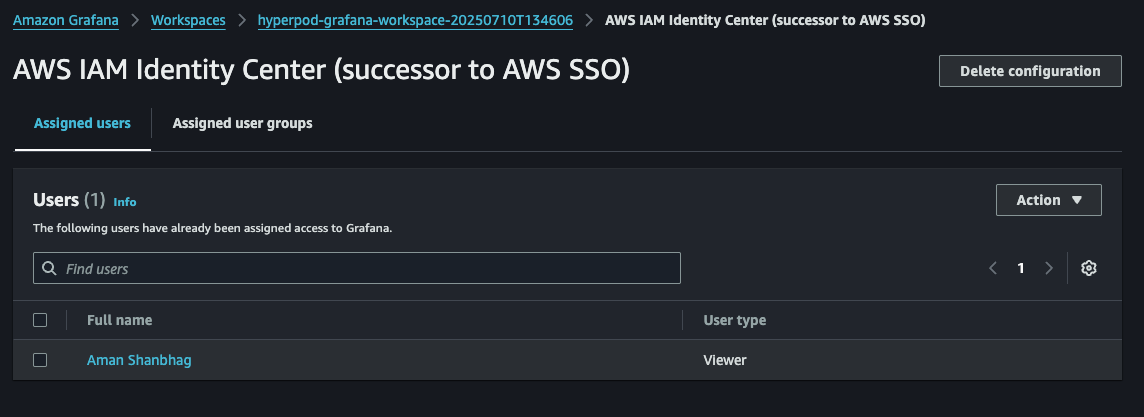
Make sure that your user(s) have access to the Grafana workspace before logging in (otherwise you will get a Login failed [sso.auth.access-denied] from Grafana while attempting to log in). To do this, navigate to Amazon Grafana on your console, go to "Workspaces", and choose the hyperpod-grafana-workspace-xxx workspace.
On there, navigate to "AWS IAM Identity Center (successor to AWS SSO), and add your user(s) under "Assigned users. Make sure you give your users "Viewer"/"Admin" permissions as required:
You should now have the dashboards accessible! See What Dashboards can I access?.
[Advanced Setup] Enable SageMaker HyperPod Observability
The Quick installation option will create a new workspace for Prometheus and Grafana and select default metrics. If you want to reuse an existing workspace, select additional metrics, or enable Pod logging to Amazon CloudWatch Logs, use the Custom installation option. This page describes the process to enable these.
Enabling additional metrics
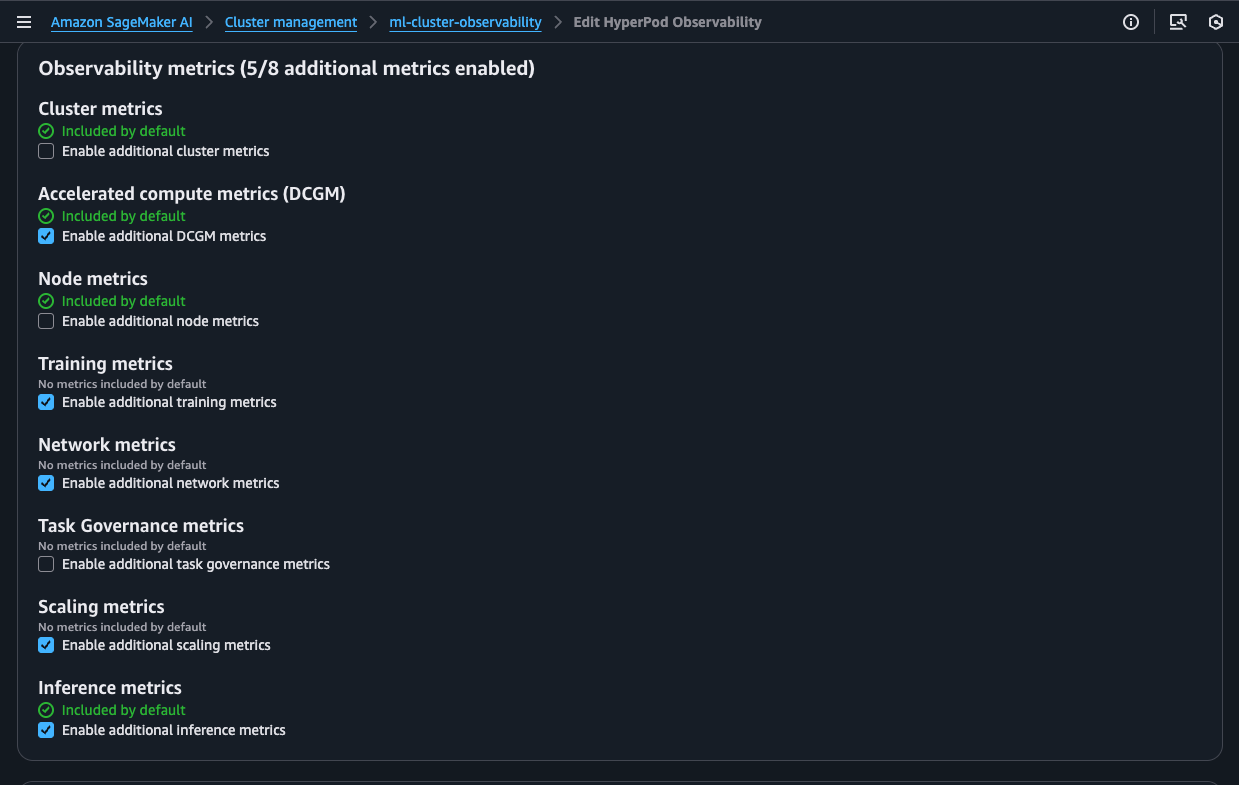
By default, the quick installation comes with some basic metrics (and dashboards). If you're looking for more granularity for each of the metric groups, we also have the option to "enable additional metrics".
To do this with an existing add-on, navigate to your SageMaker HyperPod cluster page, and under "HyperPod observability", hit "Edit".
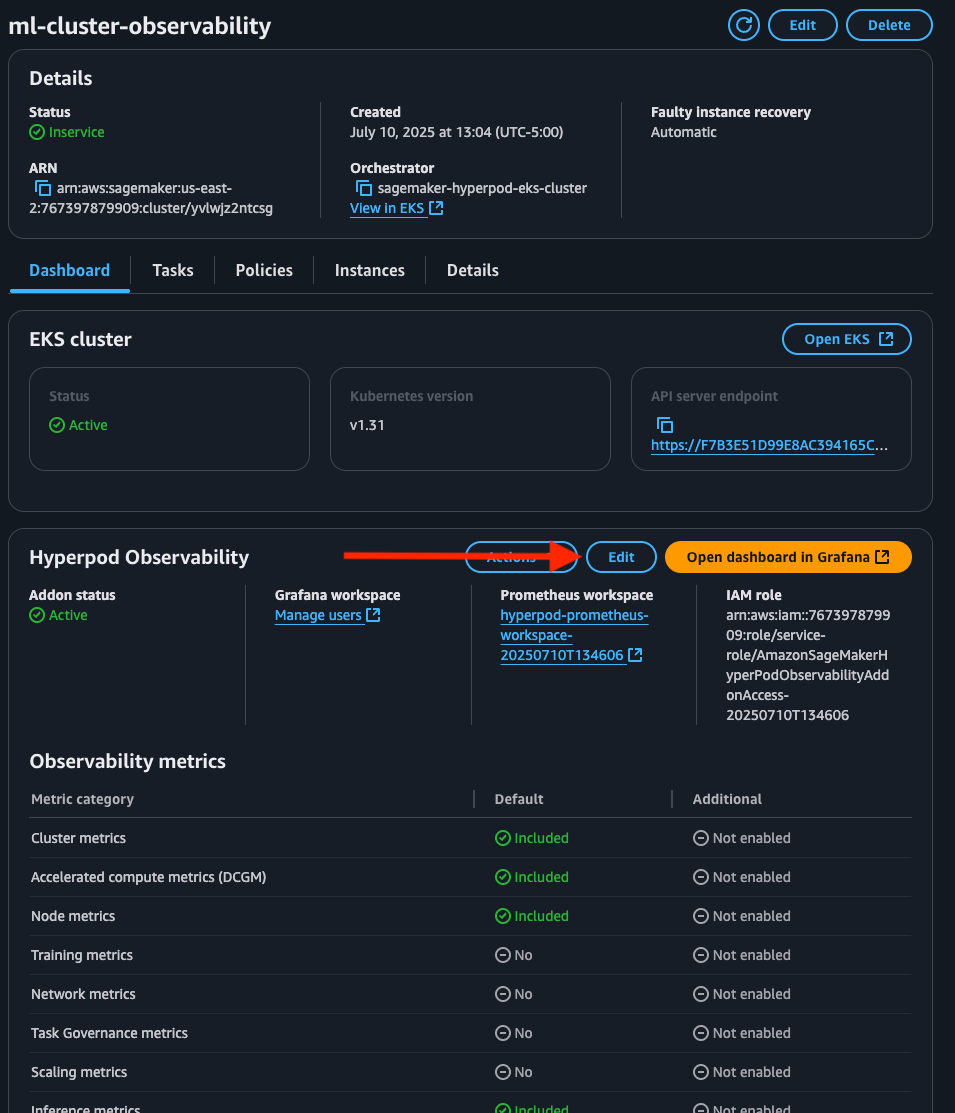
On the "Edit HyperPod Observability" page, you can hit "Enable additional cluster metrics" for:
- Metrics that are already included in the quick installation, but you're looking for additional granularity (marked "Included by default")
- Enable metrics that aren't enabled by default in the quick installation
Make sure you choose the right Grafana and Prometheus workspaces! (The defaults should be right)
If you're looking to do this with a new setup (i.e., before using the quick installation), you can directly choose these metrics on the setup page by choosing "Custom install".
Remember: Grafana is customizable! If there are additional metrics you would like to see, then you can customize these dashboards. Check out Building dashboards for more information.
Creating custom SageMaker HyperPod cluster metrics
The SageMaker HyperPod observability add-on provides hundreds of health, performance, and efficiency metrics out-of-the-box. In addition to those metrics, you might need to monitor custom metrics specific to your applications or business needs that aren't captured by default metrics, such as model-specific performance indicators, data processing statistics, or application-specific measurements. To address this need, you can implement custom metrics collection using OpenTelemetry by integrating a Python code snippet into your application.
To create custom metrics, you need to install the OpenTelemetry components required by your HyperPod cluster to emit custom telemetry data (collected by OTEL).
pip install opentelemetry-api opentelemetry-sdk opentelemetry-exporter-otlp-proto-grpc
(From AWS Documentation) The following example script configures an OpenTelemetry metrics pipeline that automatically tags metrics with pod and node information, ensuring proper attribution within your cluster, and sends these metrics to the SageMaker HyperPod built-in observability stack every second. The script establishes a connection to the HyperPod metrics collector, sets up appropriate resource attributes for identification, and provides a meter interface through which you can create various types of metrics (counters, gauges, or histograms) to track any aspect of your application's performance. Custom metrics integrate with the SageMaker HyperPod monitoring dashboards alongside system metrics. This integration allows for comprehensive observability through a single interface where you can create custom alerts, visualizations, and reports to monitor your workload's complete performance profile.
You can use this as a template for creating your own metrics for your applications.
import os
from opentelemetry import metrics
from opentelemetry.exporter.otlp.proto.grpc.metric_exporter import OTLPMetricExporter
from opentelemetry.sdk.metrics import MeterProvider
from opentelemetry.sdk.metrics.export import PeriodicExportingMetricReader
from opentelemetry.sdk.resources import Resource

# Get hostname/pod name
hostname = os.uname()[1]
node_name = os.getenv('NODE_NAME', 'unknown')

collector_endpoint = "hyperpod-otel-collector.hyperpod-observability:4317"

# Configure the OTLP exporter
exporter = OTLPMetricExporter(
    endpoint=collector_endpoint,
    insecure=True,
    timeout=5000  # 5 seconds timeout
)

reader = PeriodicExportingMetricReader(
    exporter,
    export_interval_millis=1000
)

resource = Resource.create({
    "service.name": "metric-test",
    "pod.name": hostname,
    "node.name": node_name
})

meter_provider = MeterProvider(
    metric_readers=[reader],
    resource=resource
)
metrics.set_meter_provider(meter_provider)

# Create a meter
meter = metrics.get_meter("test-meter")

# Create a counter
counter = meter.create_counter(
    name="test.counter",
    description="A test counter"
)

counter.add(1, {"pod": hostname, "node": node_name})
Enabling CloudWatch logs for your pods and containers
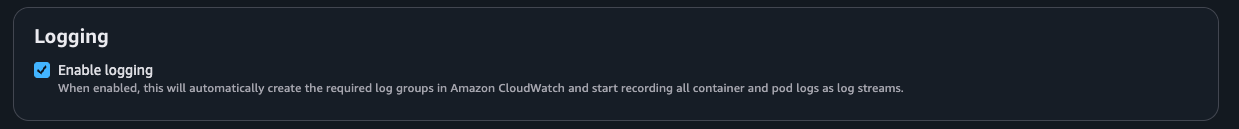
When enabled, this feature will allow you to emit all your pod/container logs as log streams (in log groups) on Amazon CloudWatch. The log groups are created when you choose to enable this option.
On the "Edit HyperPod Observability" page, navigate to "Logging", and check the "Enable logging" box.
What dashboards can I access?
SageMaker HyperPod Observability Dashboards
Out of the box (with the easy installation described on this page), the dashboards provided are:
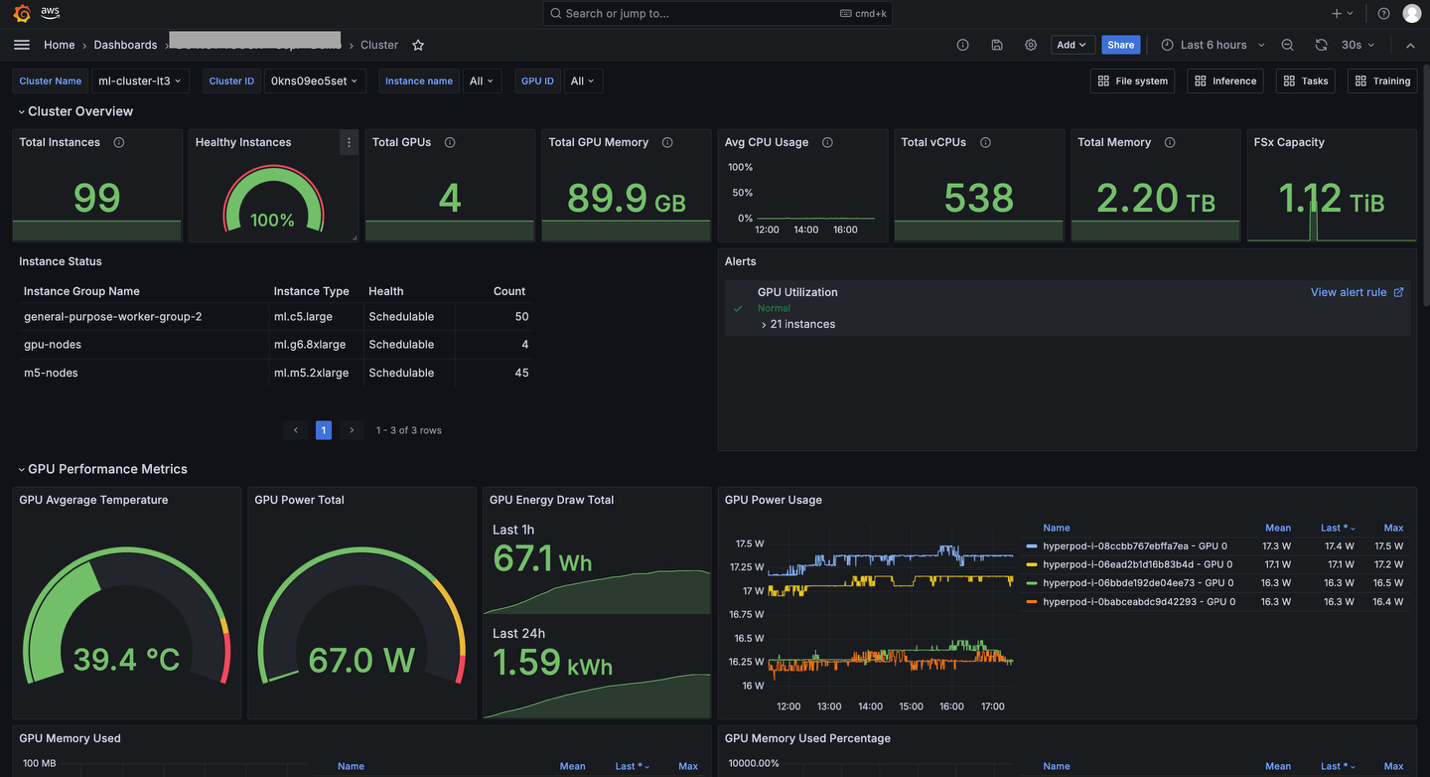
- Cluster metrics (includes
Cluster metrics,Accelerated compute metrics (DCGM),Node metricsfrom setup page): Shows cluster-level metrics such as Total Nodes and Total GPUs, among other cluster metrics such as GPU Utilization and Filesystem space available. By default, the dashboard shows metrics about entire cluster, but you can apply filters to show metrics only about a specific hostname or specific GPU ID.
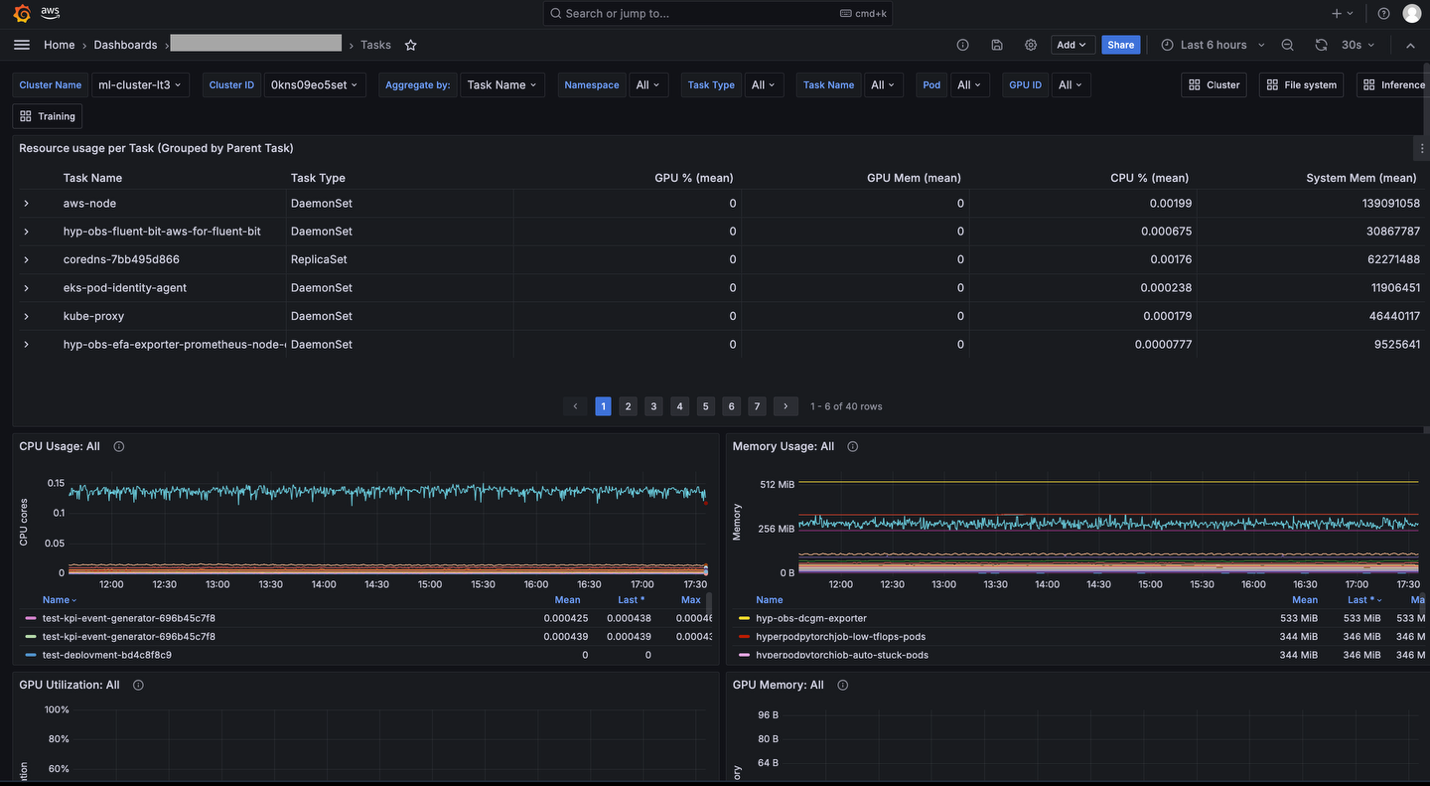
- Task metrics (includes
Task Governance metricsand other task level metrics): The Tasks dashboard is helpful if you want to see resource allocation and utilization metrics at the task level (PyTorchJob,ReplicaSet, and so on). For example, you can compare GPU utilization by multiple tasks running on your cluster and identify which task should be improved.
These dashboards allow you to drill down into specific metrics via "aggregations". You can choose an aggregation level from multiple options (Namespace, Task Name, Task Pod), and apply filters (Namespace, Task Type, Task Name, Pod, GPU ID). You can use these aggregation and filtering capabilities to view metrics at the appropriate granularity and drill down into the specific issue you are investigating.
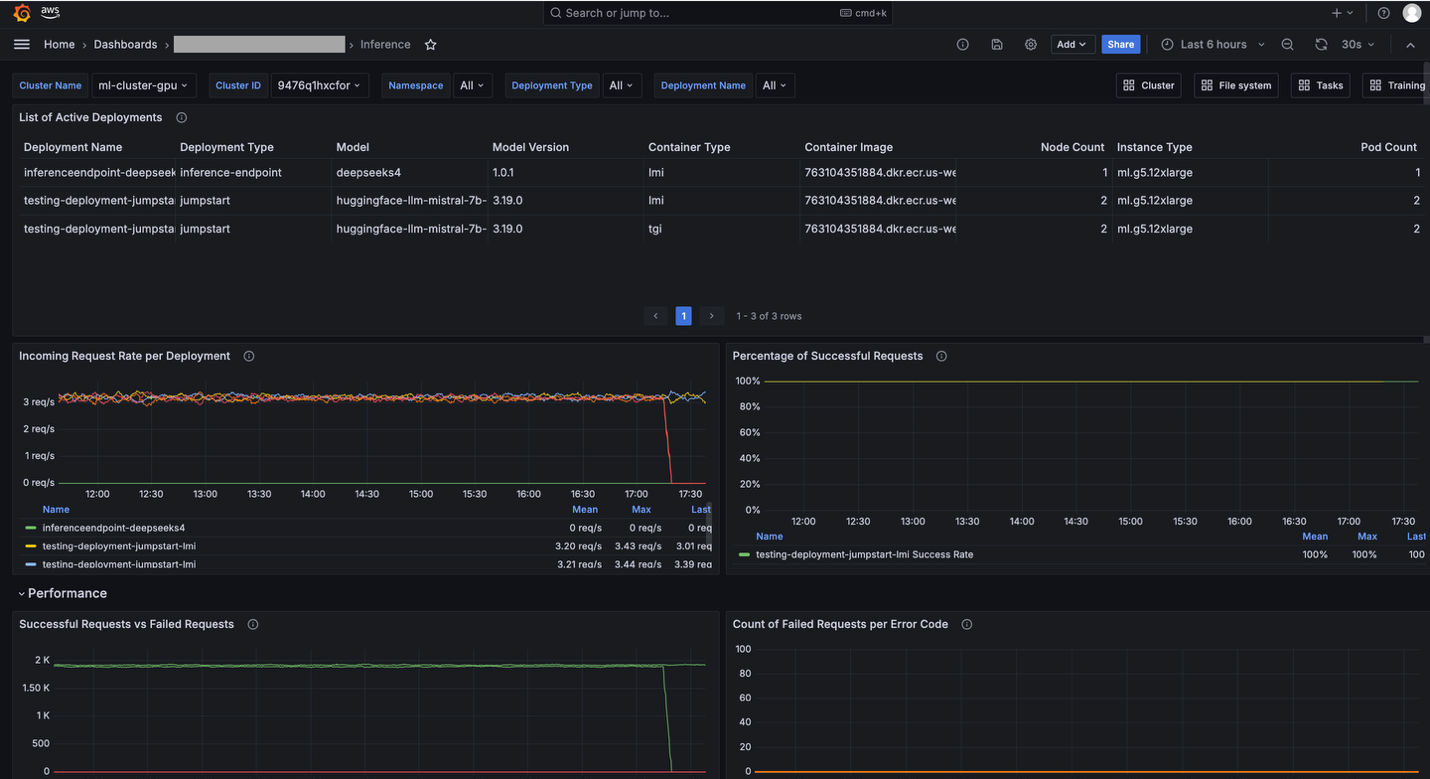
- Training & Inference (includes
Inference metricsandScaling metrics): The Training and Inference dashboards show training and/or inference application specific metrics such as Auto Restart Count, Training Task Resiliency, Incoming Requests, Latency, and Time to First Byte (TTFB). These dashboards are particularly useful when you use SageMaker HyperPod clusters for training and/or inference and need to monitor the traffic of the requests and performance of models.
Cluster metrics
SageMaker HyperPod publishes various metrics across 9 distinct categories to your Amazon Managed Service for Prometheus workspace. Not all metrics are enabled by default or displayed in your Amazon Managed Grafana workspace. The following table shows which metrics are enabled by default when you install the observability add-on, which categories have additional metrics that can be enabled for more granular cluster information, and where they appear in the Amazon Managed Grafana workspace.
For more information on what metrics are enabled and which aren't, check out the documentation.