Observability with AMP and AMG (Slurm only)
Overview
SageMaker HyperPod can optionally be integrated with Amazon Managed Prometheus and Amazon Managed Grafana to export metrics about your cluster and cluster-nodes to a Grafana dashboard.
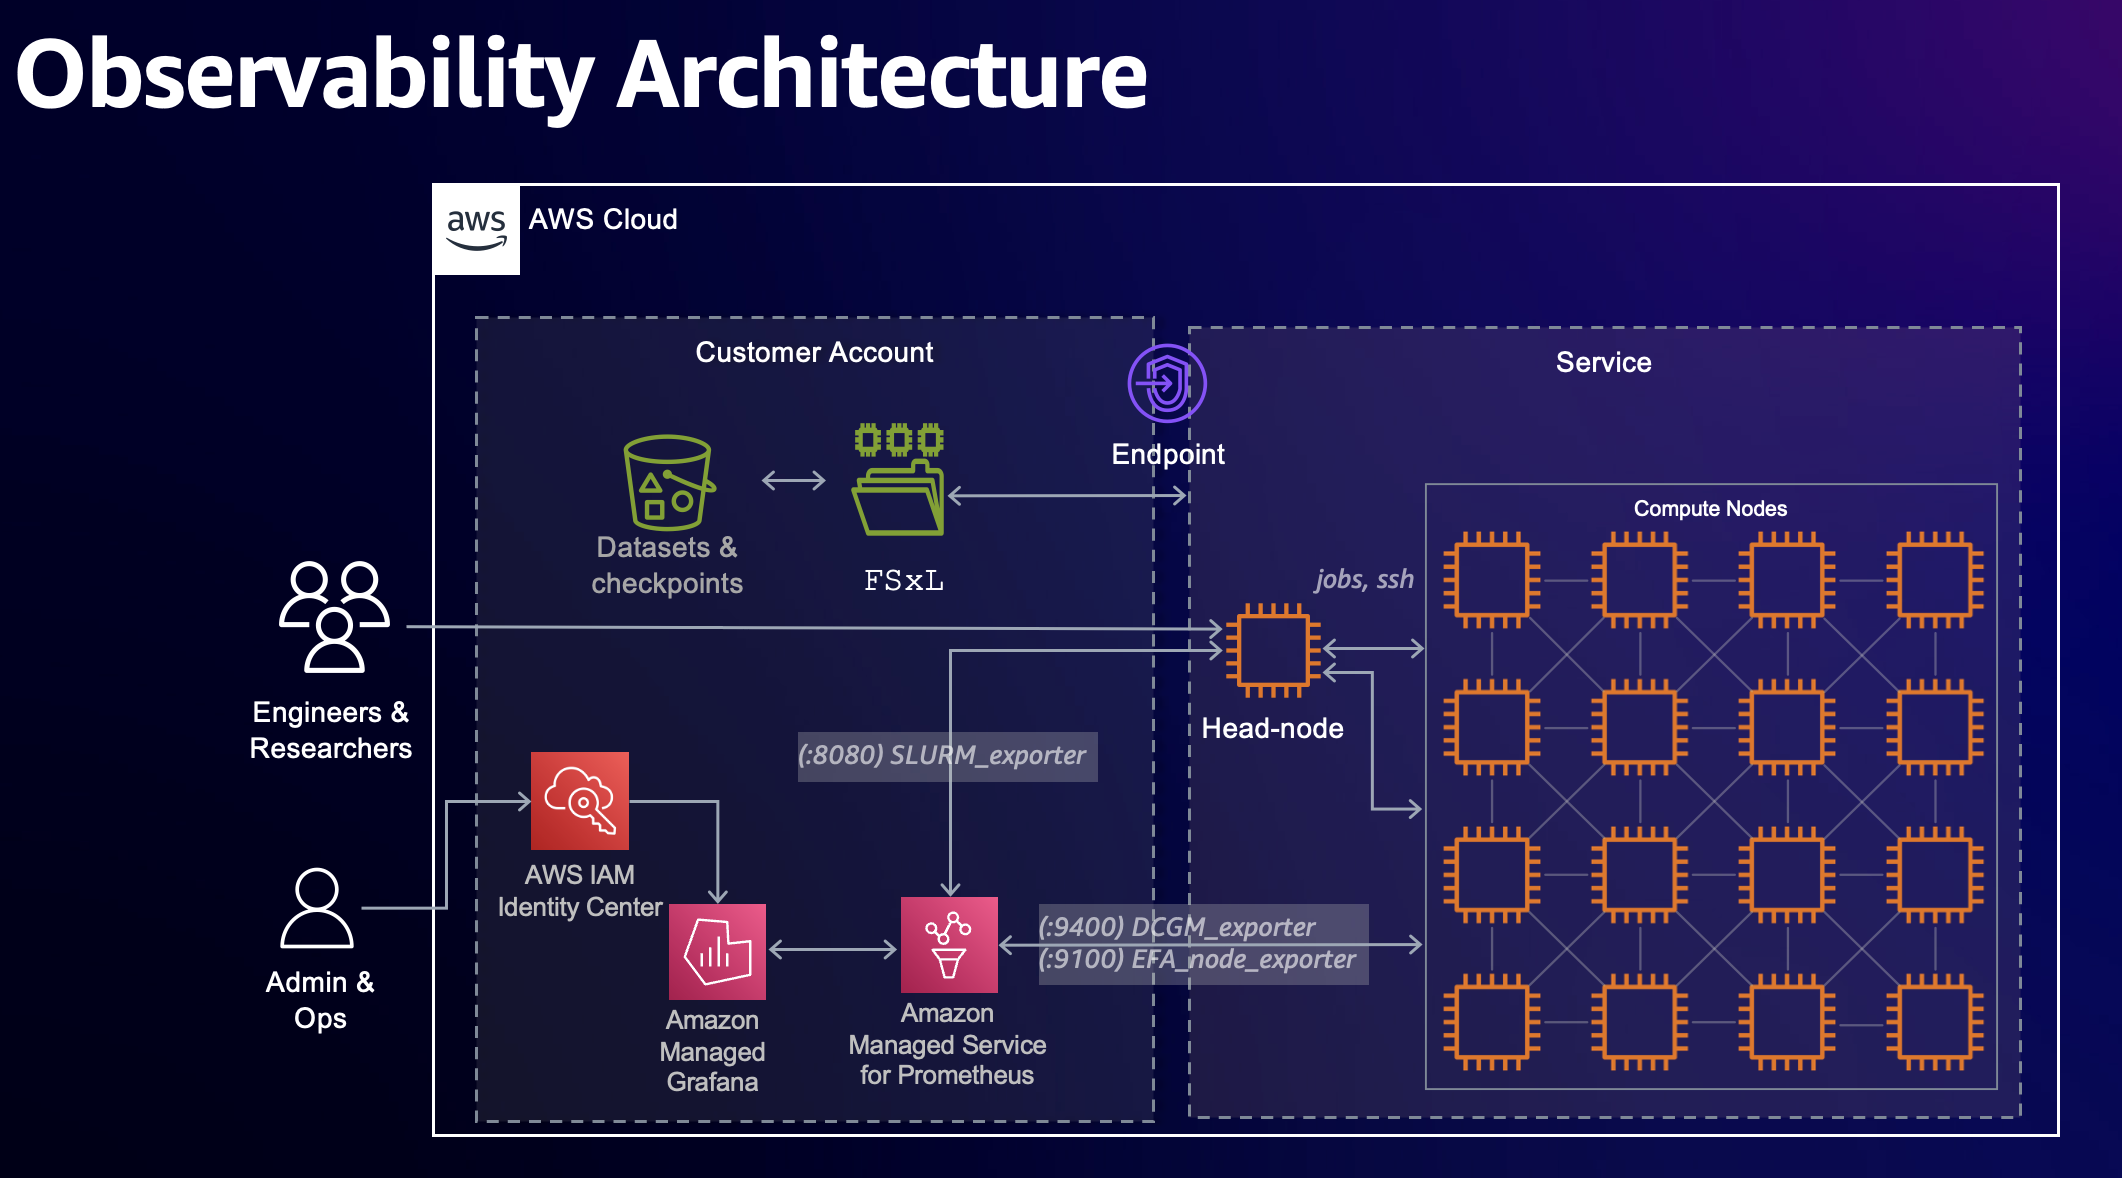
This solution uses CloudFormation to deploy workspaces for Amazon Managed Prometheus and Grafana, and Hyperpod Lifecycle Scripts to install metrics exporters and OpenTelemetry Collector (OTEL) to your cluster. Also, you can install the solution to existing clusters as well by running commands interactively on the head node (Ad-hoc installation).
Not all metrics are enabled by default or displayed in your Grafana workspace. Some metrics are categorized as Advanced metrics. Check the SageMaker HyperPod cluster metrics page for more details.
Two Deployment Options
There are two methods to deploy observability for SageMaker HyperPod:
- Amazon Managed Grafana (AMG) + Amazon Managed Prometheus (AMP) - Fully managed solution with IAM Identity Center authentication
- Open Source Grafana + Amazon Managed Prometheus - Self-managed Grafana you don't have Identity Center access
Choose the method that best fits your organization's requirements and authentication setup.
Method 1: Amazon Managed Grafana + Amazon Managed Prometheus
This is the recommended approach for production environments with IAM Identity Center enabled.
Setup
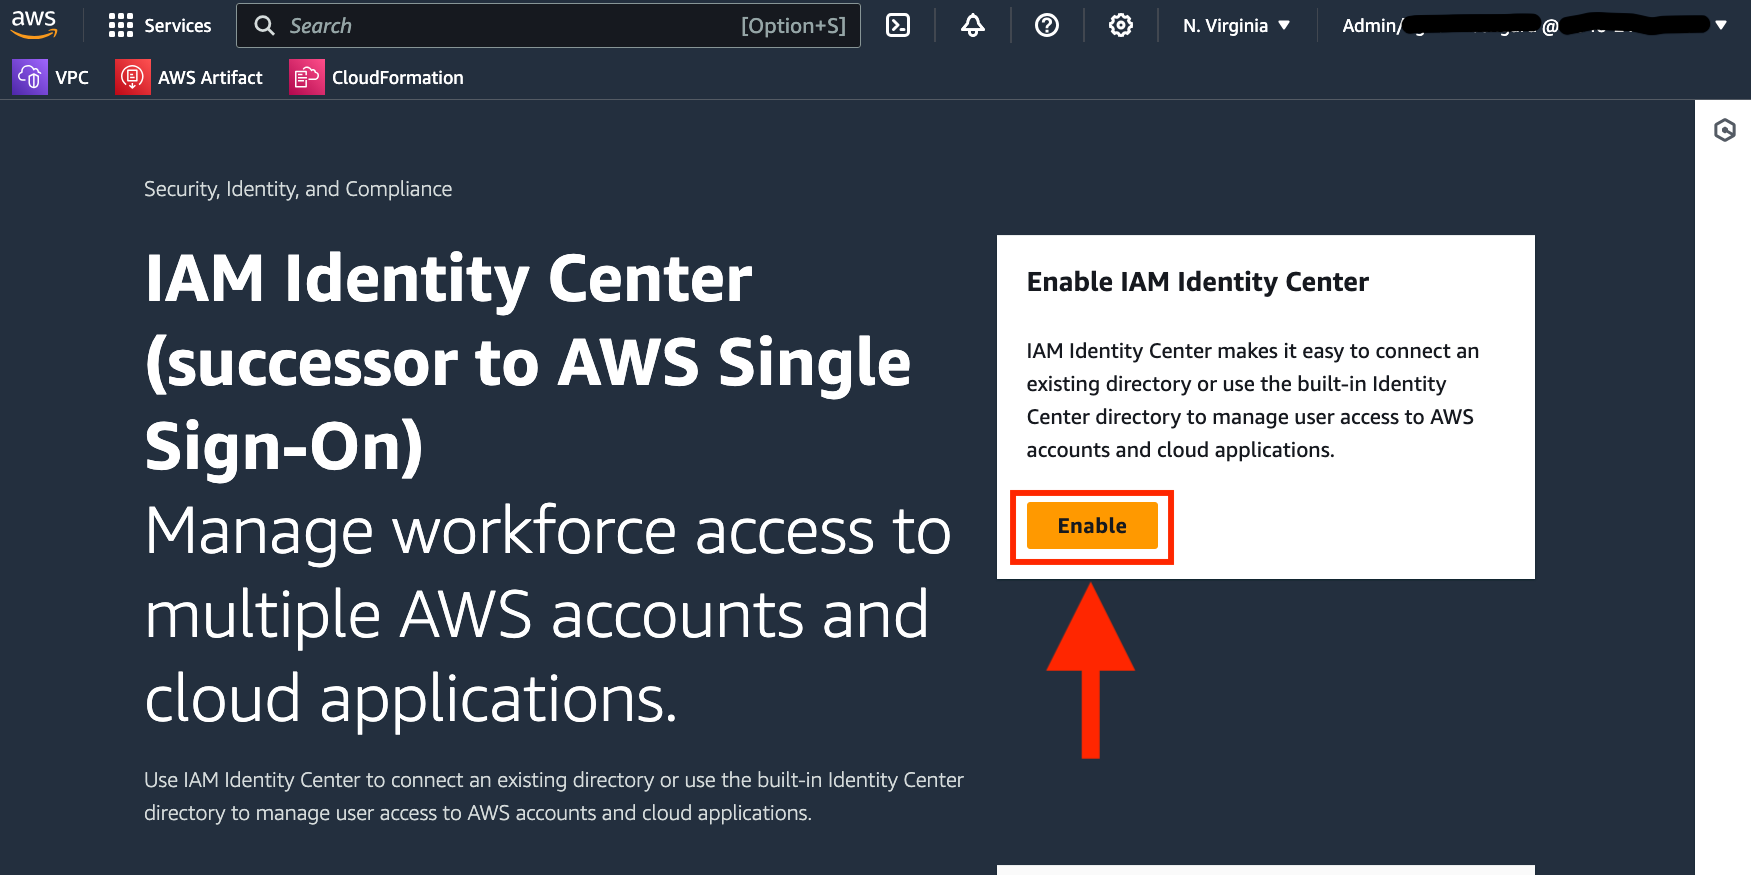
1. Enable IAM Identity Center
As a prerequisite to deploying this stack, you will need to have IAM Identity Center enabled for your account or organization. Amazon Managed Grafana uses IAM Identity Center to authenticate users to your dashboards. You can do this through the IAM Identity Center AWS Console.
2. Add additional permissions
Also, you need to add following additional permissions to the IAM role for HyperPod instance groups.
2-a. Managed policy
AmazonPrometheusRemoteWriteAccess
2-b. Inline policy
{
    "Version": "2012-10-17",
    "Statement": [
        {
            "Sid": "VisualEditor0",
            "Effect": "Allow",
            "Action": [
                "ecr:BatchGetImage",
                "ecr:GetAuthorizationToken",
                "ecr:GetDownloadUrlForLayer"
            ],
            "Resource": "*"
        }
    ]
}
3. Create workspaces for Prometheus and Grafana
Deploy the CloudFormation stack for your Amazon Managed Prometheus workspace and Amazon Managed Grafana workspace. It will automatically install pre-configured dashboards in your Grafana workspace. You can leave all parameters at their defaults.
This template creates Amazon Managed Prometheus and Amazon Managed Grafana workspaces with pre-configured dashboards.
Make sure you deploy this stack in the region where your HyperPod cluster is located.
If you do not have Identity Center access, then please use Method 2: Open Source Grafana + Amazon Managed Prometheus below.
4. Add users to the Grafana workspace
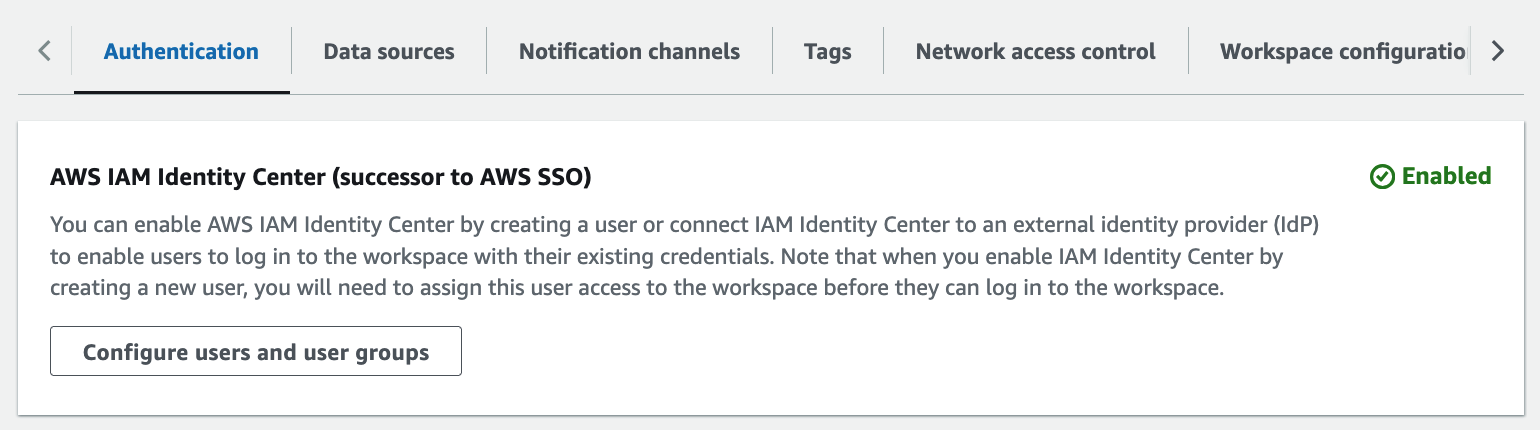
From the Management Console for Amazon Managed Grafana, select the workspace you just created by the CloudFormation.
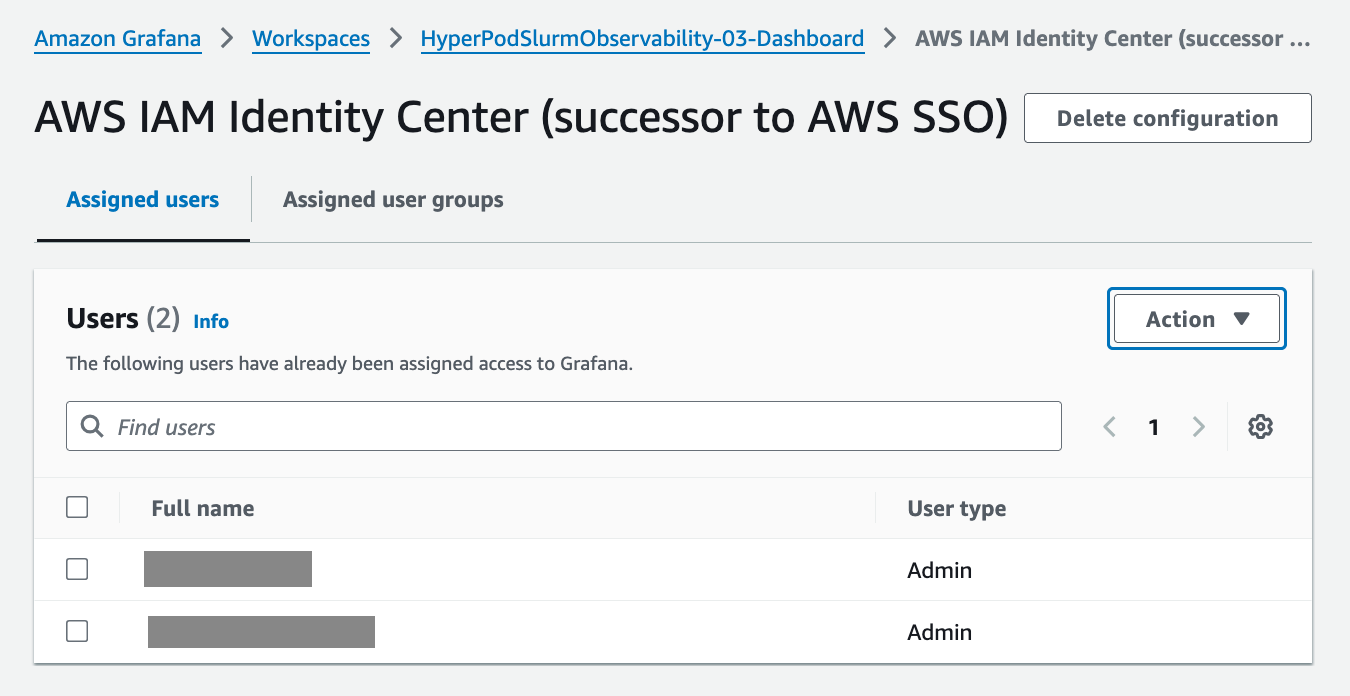
Select the Configure users and groups button and add your user.
From the Action menu, select Assign user and Make admin to configure users for who need access to the Grafana workspace.
5. Modify the lifecycle scripts
To install the metric exporters and OTEL collector on your cluster, edit the lifecycle scripts for the cluster by following these steps:
-
Locate the Prometheus remote write URL in the
Outputstab of the CloudFormation stack you just deployed. You will use the URL to configure the lifecycle scripts.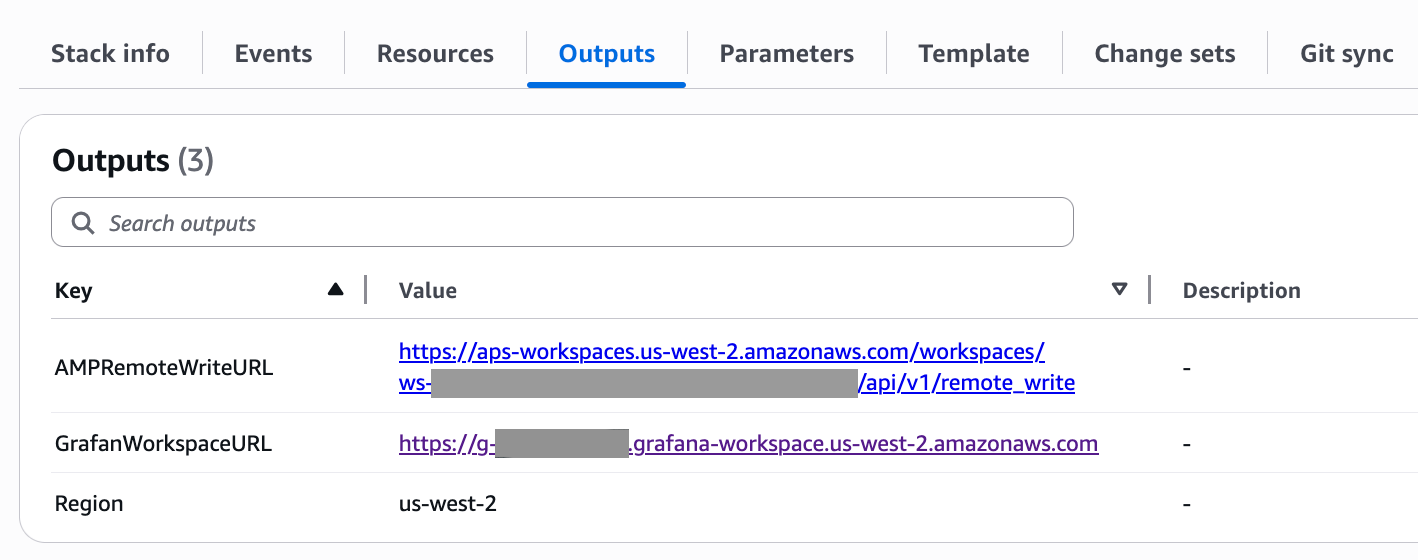
-
If you don't have a copy of the lifecycle scripts locally, download them to your development machine so you can edit.
aws s3 sync s3://{bucket-name}/ ./{local-working-directory} -
Open the
config.pyfile with your text editor, and change the valueConfig.enable_observabilitytoTrue.class Config:
:
enable_observability = True
: -
Change the parameters of
ObservabilityConfig. Use the Prometheus remote write URL you located at the first step.class ObservabilityConfig:
# Prometheus remote write URL
prometheus_remote_write_url = "https://aps-workspaces.us-west-2.amazonaws.com/workspaces/{your-workspace-id}/api/v1/remote_write"
# Set true if you want to collect advanced metrics
advanced_metrics = True -
Upload the lifecycle script to S3
aws s3 sync ./{local-working-directory} s3://{bucket-name}/noteUpdating the lifecycle script is essential to ensure that metric exporters and OTEL collector are automatically configured on new cluster nodes during node replacement, scaling operations, and software updates.
6. Install Observability in your cluster
There are two options for installing observabability on a your HyperPod cluster, depending on where you are creating a new cluster from now or installing the observability on an existing cluster.
6-1. Create a new cluster
If you are creating a new HyperPod cluster, use the lifecycle scripts you updated in the steps above. The lifecycle scripts will install necessary components (metrics exporters and OTEL collector) in your cluster.
6-2. Ad-hoc installation
You can also enable Observability for an existing cluster by following these steps.
-
Login to the head node by SSM or SSH.
-
Set environment variables based on the number of worker nodes you have.
# Number of worker nodes you have
export NUM_WORKERS=16

# Prometheus remote write URL you configured in the lifecycle script config.
export PROMETHEUS_REMOTE_WRITE_URL=https://aps-workspaces.us-west-2.amazonaws.com/workspaces/{your-workspace-id}/api/v1/remote_write

# Set `--advanced` if you configured `advanced_metrics` to True in the lifecycle script config.
export ARG_ADVANCED=--advanced -
Make sure the Linux user you are using has sudo priviledge on both head node and worker nodes.
sudo hostname
srun -N $NUM_WORKERS sudo hostname -
Clone the
https://github.com/aws-samples/awsome-distributed-training.gitrepository under a shared file system.mkdir ~/observability-setup
cd ~/observability-setup
git clone https://github.com/aws-samples/awsome-distributed-training.git
cd awsome-distributed-training/1.architectures/5.sagemaker-hyperpod/LifecycleScripts/base-config/observability -
Stop observability components if they are running already running
sudo python3 stop_observability.py --node-type controller
srun -N $NUM_WORKERS sudo python3 stop_observability.py --node-type compute -
Install and run observability components
sudo python3 install_observability.py --node-type controller --prometheus-remote-write-url $PROMETHEUS_REMOTE_WRITE_URL $ARG_ADVANCED
srun -N $NUM_WORKERS sudo python3 install_observability.py --node-type compute --prometheus-remote-write-url $PROMETHEUS_REMOTE_WRITE_URL $ARG_ADVANCED -
Verify status of containers and services
systemctl status slurm_exporter.service --no-pager -l
docker ps
srun -N $NUM_WORKERS docker ps
Example output
● slurm_exporter.service - Prometheus SLURM Exporter
    Loaded: loaded (/etc/systemd/system/slurm_exporter.service; enabled; vendor preset: enabled)
    Active: active (running) since Thu 2025-09-11 04:27:30 UTC; 1 day 20h ago
Main PID: 2408455 (slurm_exporter)
    Tasks: 39 (limit: 152887)
    Memory: 12.0M
        CPU: 35min 28.668s
    CGroup: /system.slice/slurm_exporter.service
            └─2408455 /usr/bin/slurm_exporter

Sep 11 04:27:30 ip-10-1-206-211 slurm_exporter[2408455]: time=2025-09-11T04:27:30.540Z level=INFO msg="Collector enabled" collector=users
Sep 11 04:27:30 ip-10-1-206-211 slurm_exporter[2408455]: time=2025-09-11T04:27:30.540Z level=INFO msg="Collector enabled" collector=info
Sep 11 04:27:30 ip-10-1-206-211 slurm_exporter[2408455]: time=2025-09-11T04:27:30.540Z level=INFO msg="Collector enabled" collector=gpus
Sep 11 04:27:30 ip-10-1-206-211 slurm_exporter[2408455]: time=2025-09-11T04:27:30.540Z level=INFO msg="Collector enabled" collector=cpus
Sep 11 04:27:30 ip-10-1-206-211 slurm_exporter[2408455]: time=2025-09-11T04:27:30.540Z level=INFO msg="Collector enabled" collector=nodes
Sep 11 04:27:30 ip-10-1-206-211 slurm_exporter[2408455]: time=2025-09-11T04:27:30.540Z level=INFO msg="Collector enabled" collector=queue
Sep 11 04:27:30 ip-10-1-206-211 slurm_exporter[2408455]: time=2025-09-11T04:27:30.540Z level=INFO msg="Starting Slurm Exporter server..."
Sep 11 04:27:30 ip-10-1-206-211 slurm_exporter[2408455]: time=2025-09-11T04:27:30.540Z level=INFO msg="Command timeout configured" timeout=5s
Sep 11 04:27:30 ip-10-1-206-211 slurm_exporter[2408455]: time=2025-09-11T04:27:30.540Z level=INFO msg="" level=info msg="Listening on" address=[::]:9341
Sep 11 04:27:30 ip-10-1-206-211 slurm_exporter[2408455]: time=2025-09-11T04:27:30.541Z level=INFO msg="" level=info msg="TLS is disabled." http2=false address=[::>

CONTAINER ID   IMAGE                                                                                 COMMAND                  CREATED        STATUS        PORTS     NAMES
da773247a262   602401143452.dkr.ecr.us-west-2.amazonaws.com/hyperpod/otel_collector:v1754424030352   "/app/otelcollector …"   6 hours ago    Up 6 hours              otel-collector
8c18b89cc1a3   602401143452.dkr.ecr.us-west-2.amazonaws.com/hyperpod/node_exporter:v1.9.1            "/bin/node_exporter …"   45 hours ago   Up 45 hours             node-exporter

CONTAINER ID   IMAGE                                                                                  COMMAND                  CREATED        STATUS        PORTS     NAMES
eb4fa31d8b17   602401143452.dkr.ecr.us-west-2.amazonaws.com/hyperpod/otel_collector:v1754424030352    "/app/otelcollector …"   45 hours ago   Up 45 hours             otel-collector
3ac63a09ba1f   602401143452.dkr.ecr.us-west-2.amazonaws.com/hyperpod/efa_exporter:1.0.0               "./node_exporter --p…"   45 hours ago   Up 45 hours             efa-exporter
48396ed3e3ef   602401143452.dkr.ecr.us-west-2.amazonaws.com/hyperpod/dcgm_exporter:4.1.1-4.0.4-ubi9   "/usr/local/dcgm/dcg…"   45 hours ago   Up 45 hours             dcgm-exporter
216eff1c9d55   602401143452.dkr.ecr.us-west-2.amazonaws.com/hyperpod/node_exporter:v1.9.1             "/bin/node_exporter …"   45 hours ago   Up 45 hours             node-exporter
    :
7. Verification
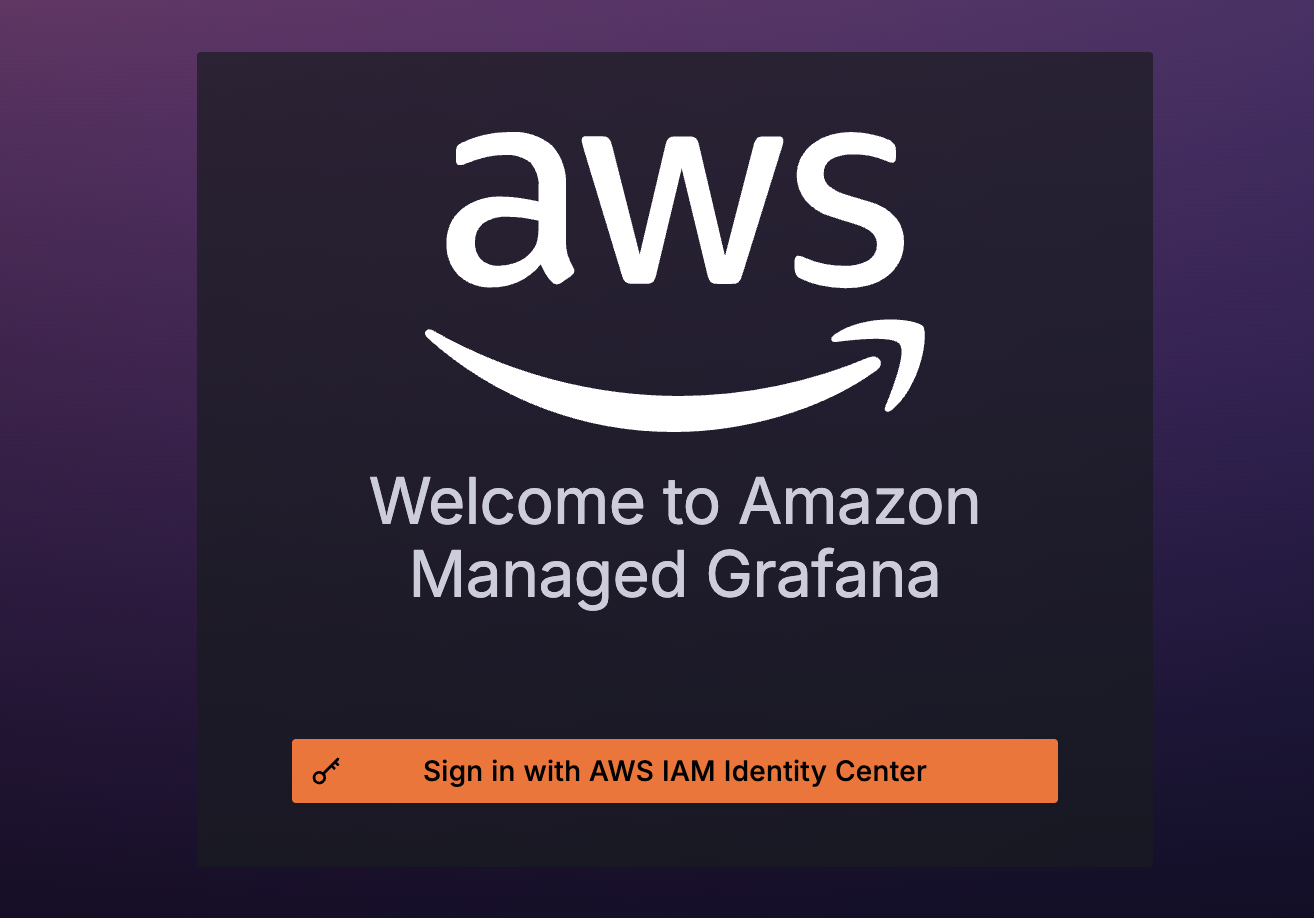
From the Management Console for Amazon Managed Grafana, select the workspace URL to open the dashboards. When the Sign-in screen pops up, login as a user you assigned in the Add users to the Grafana workspace step above.
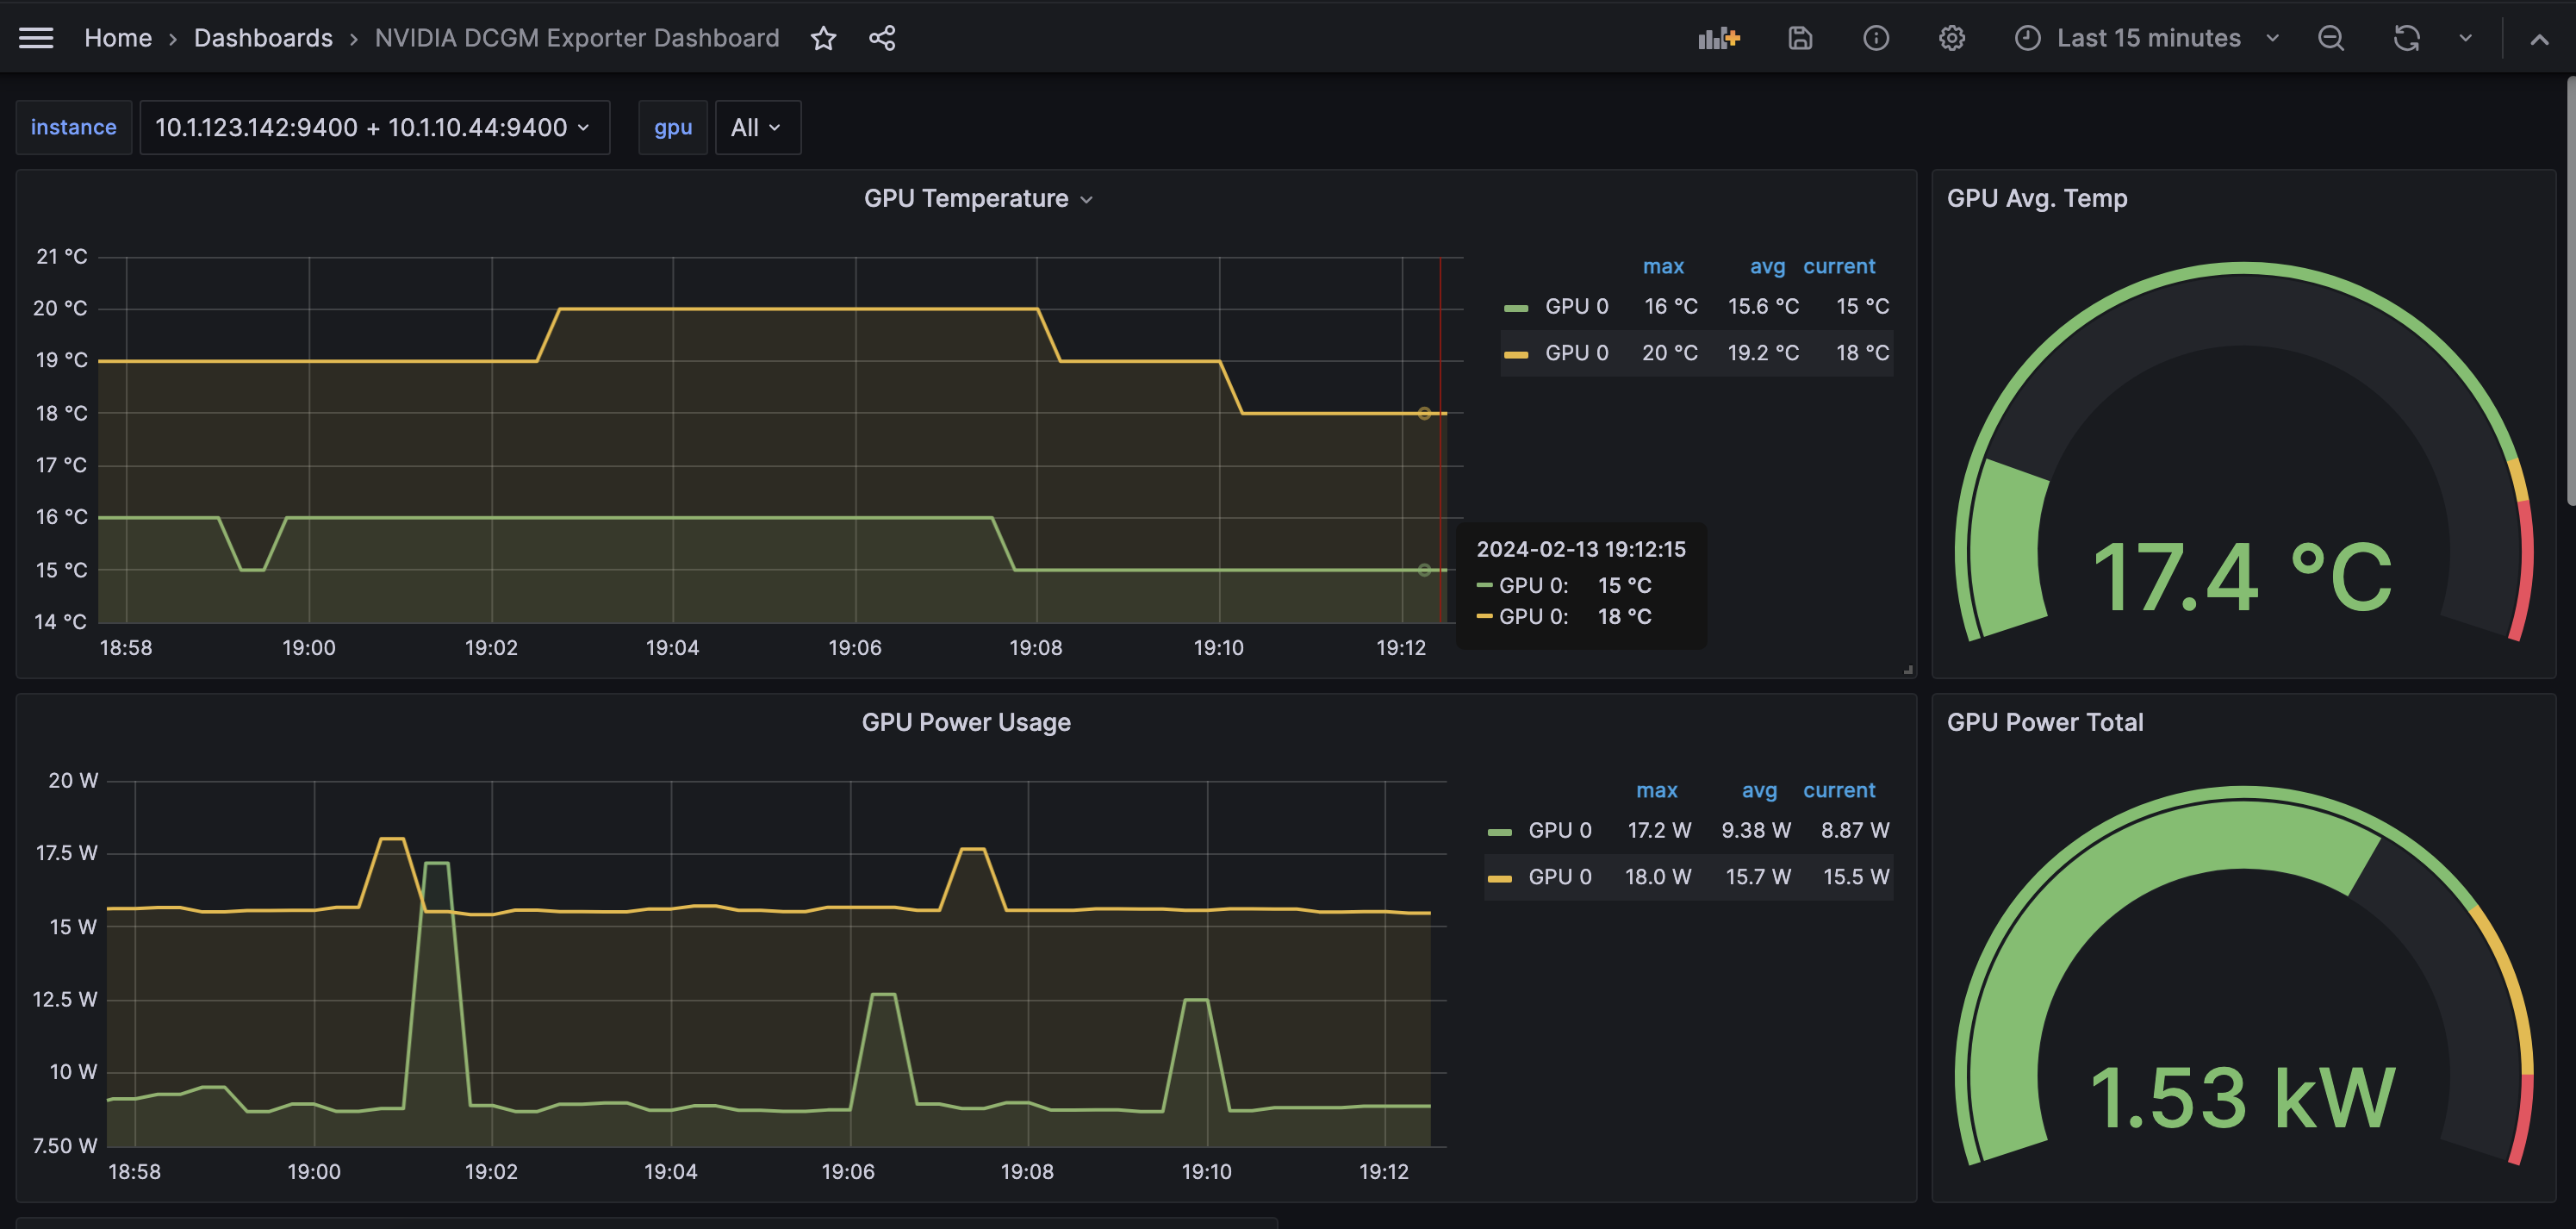
From the left navigation pane, select Dashboards, and choose one of pre-configured dashboards. Following is a sample screenshot of the NVIDIA DCGM Exporter Dashboard.
Method 2: Open Source Grafana + Amazon Managed Prometheus
This method is ideal for customers who don't have access to IAM Identity Center or prefer a self-managed Grafana solution. It deploys a t2.micro EC2 instance running Open Source Grafana container along with Amazon Managed Service for Prometheus workspace.
Open Source Grafana offers a self-managed and less secure alternative to Amazon Managed Grafana. This method OSS solution is not recommended for production deployments.
Setup
1. Deploy the CloudFormation Stack
Deploy the CloudFormation stack for Open Source Grafana and Amazon Managed Prometheus workspace. This will create an EC2 instance running Grafana and the necessary Prometheus workspace.
This template creates an EC2 instance with Open Source Grafana and Amazon Managed Prometheus workspace.
Make sure you deploy this stack in the region where your HyperPod cluster is located.
2. Access Open Source Grafana
Navigate to the AWS CloudFormation Console and fetch the GrafanaInstanceAddress output from the OS-Observability stack.
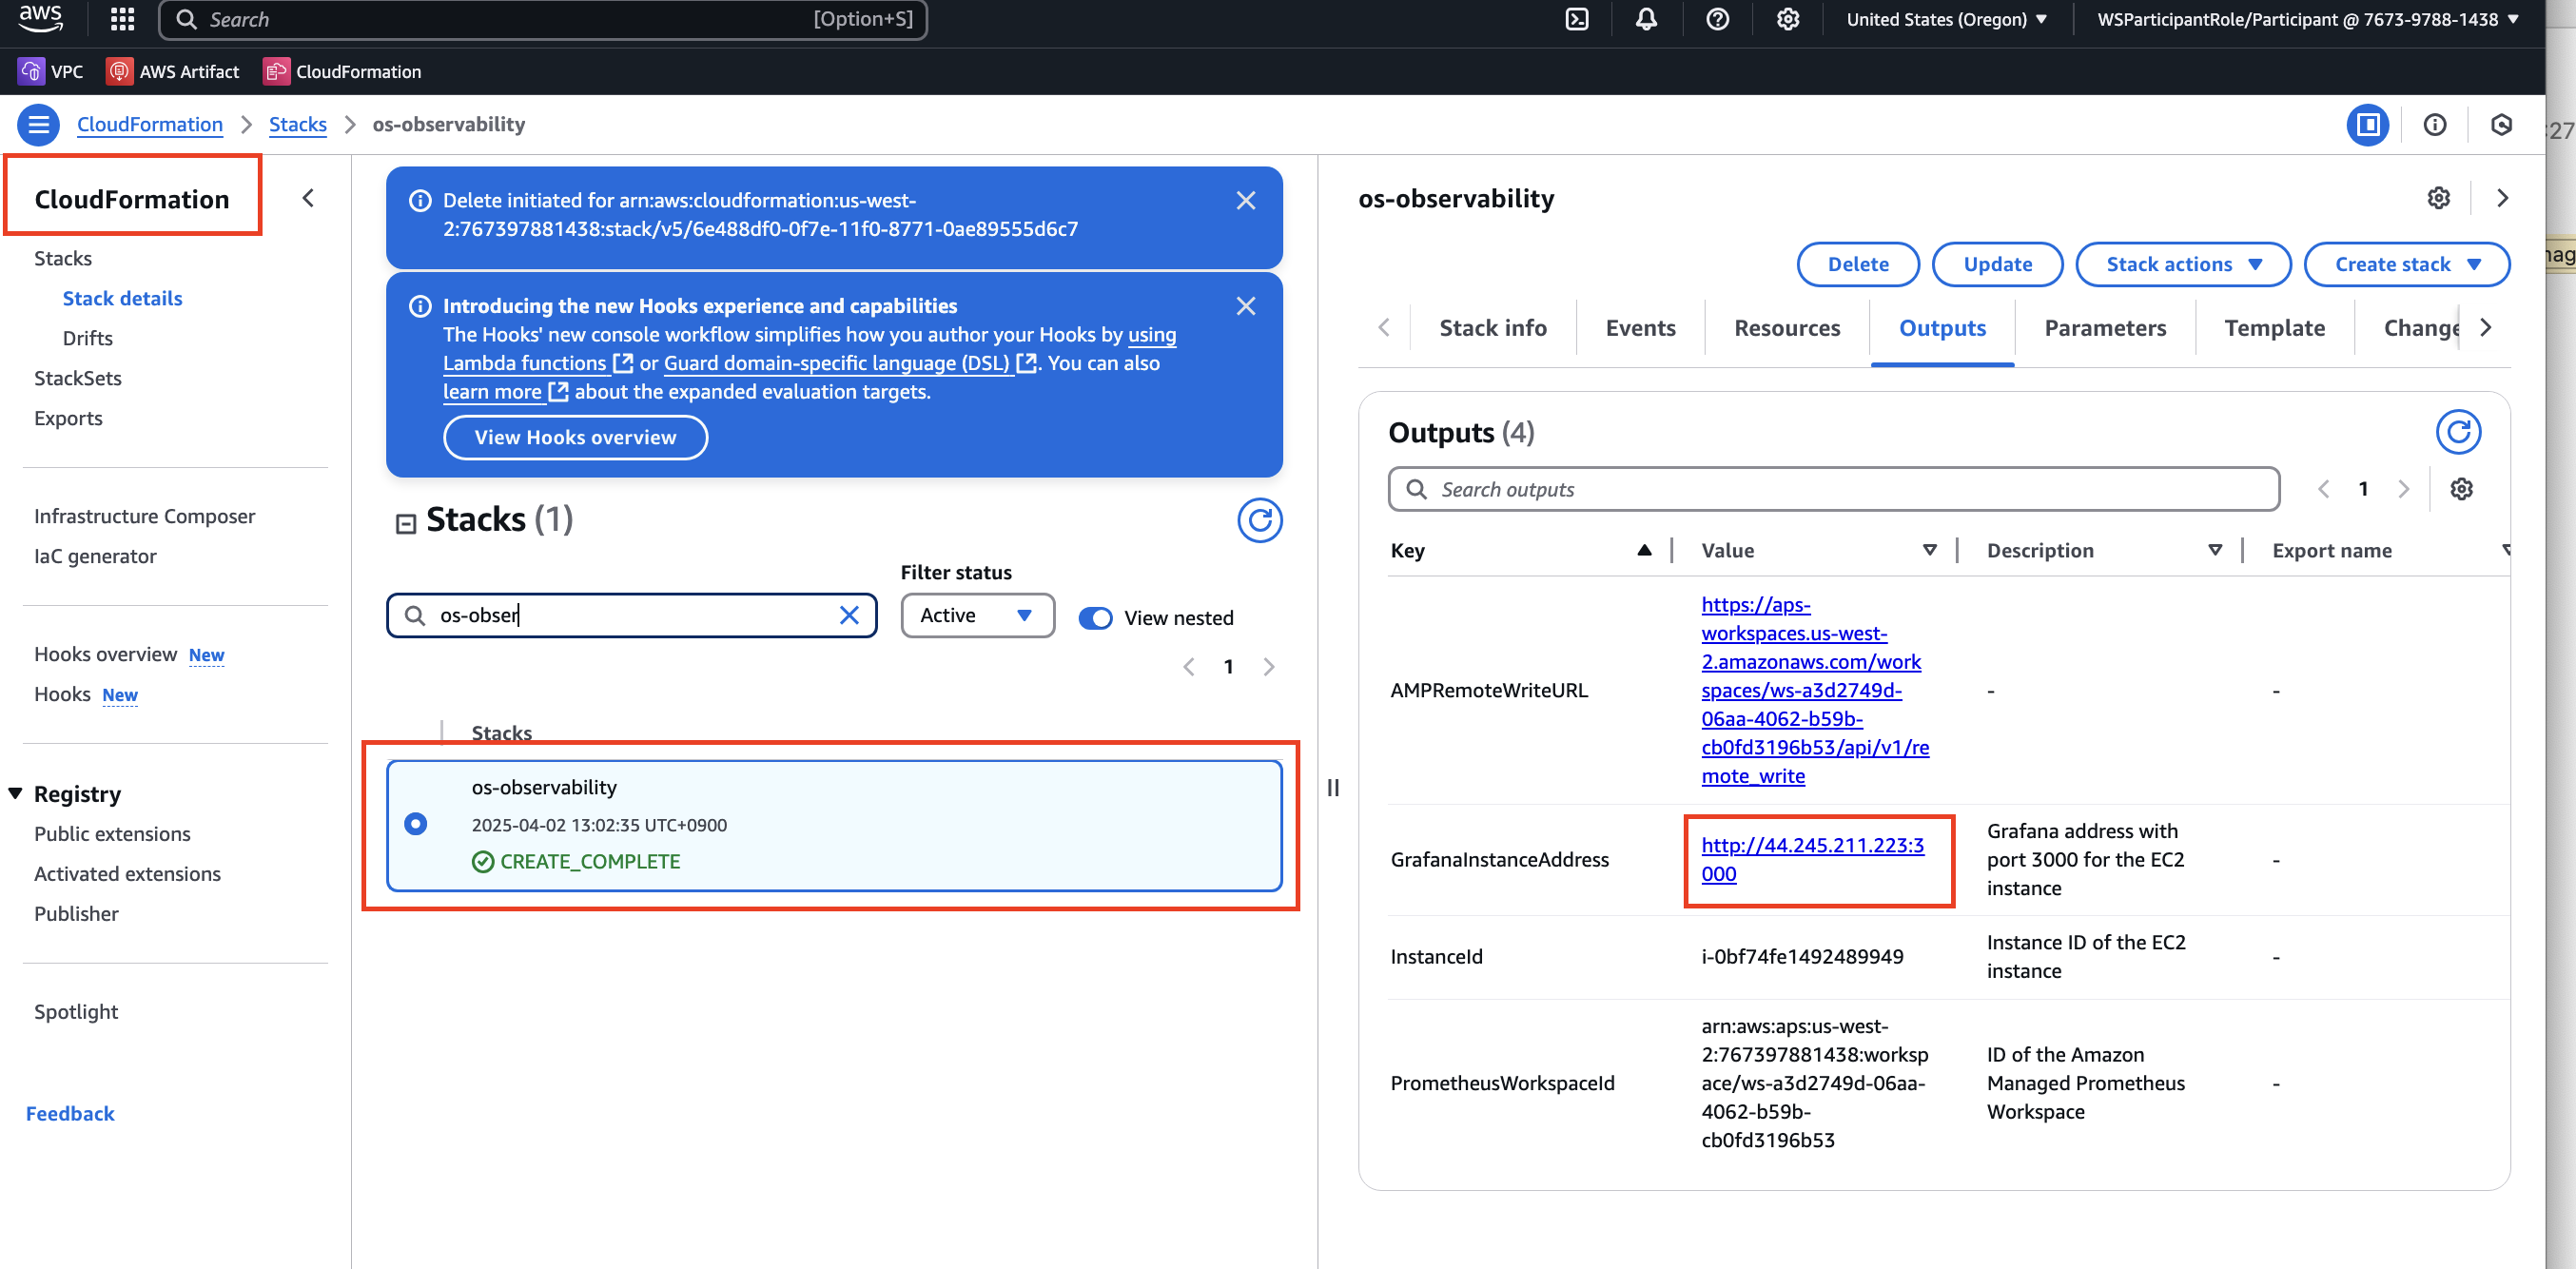
Open the Grafana link in your browser:
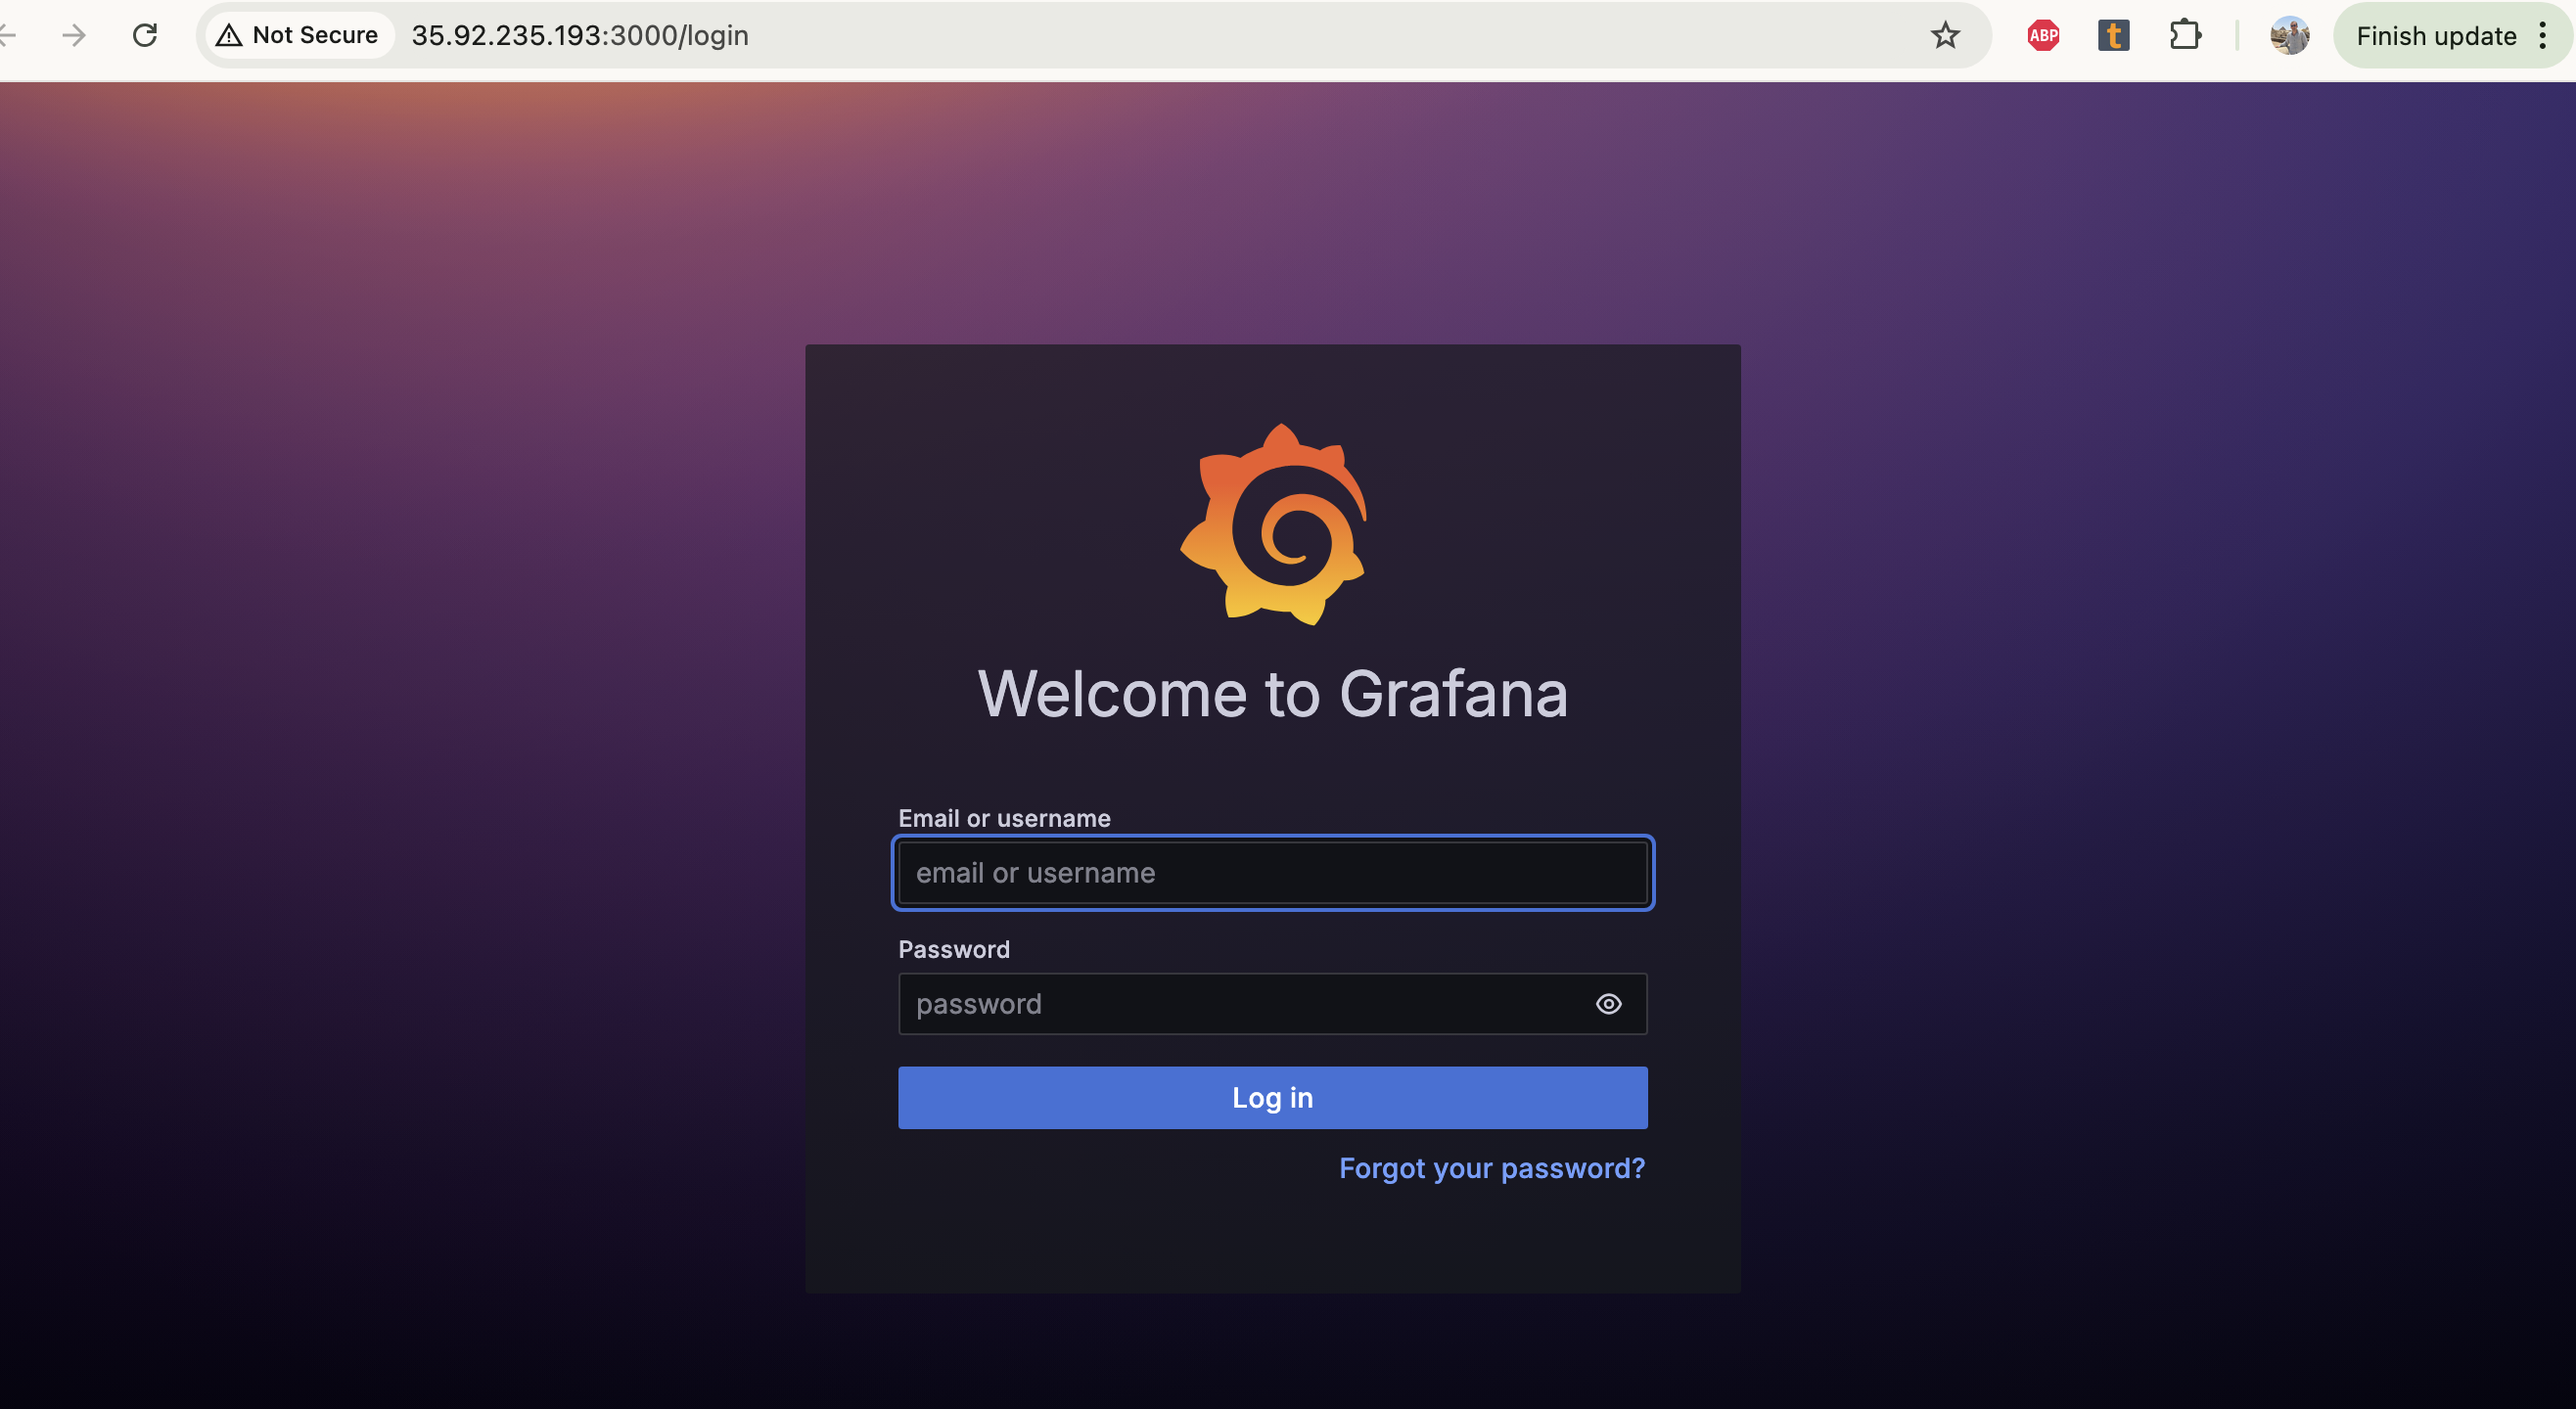
The default Grafana login credentials are admin/admin. Please change the password after the first login.
3. Set Prometheus Workspace as Data Source
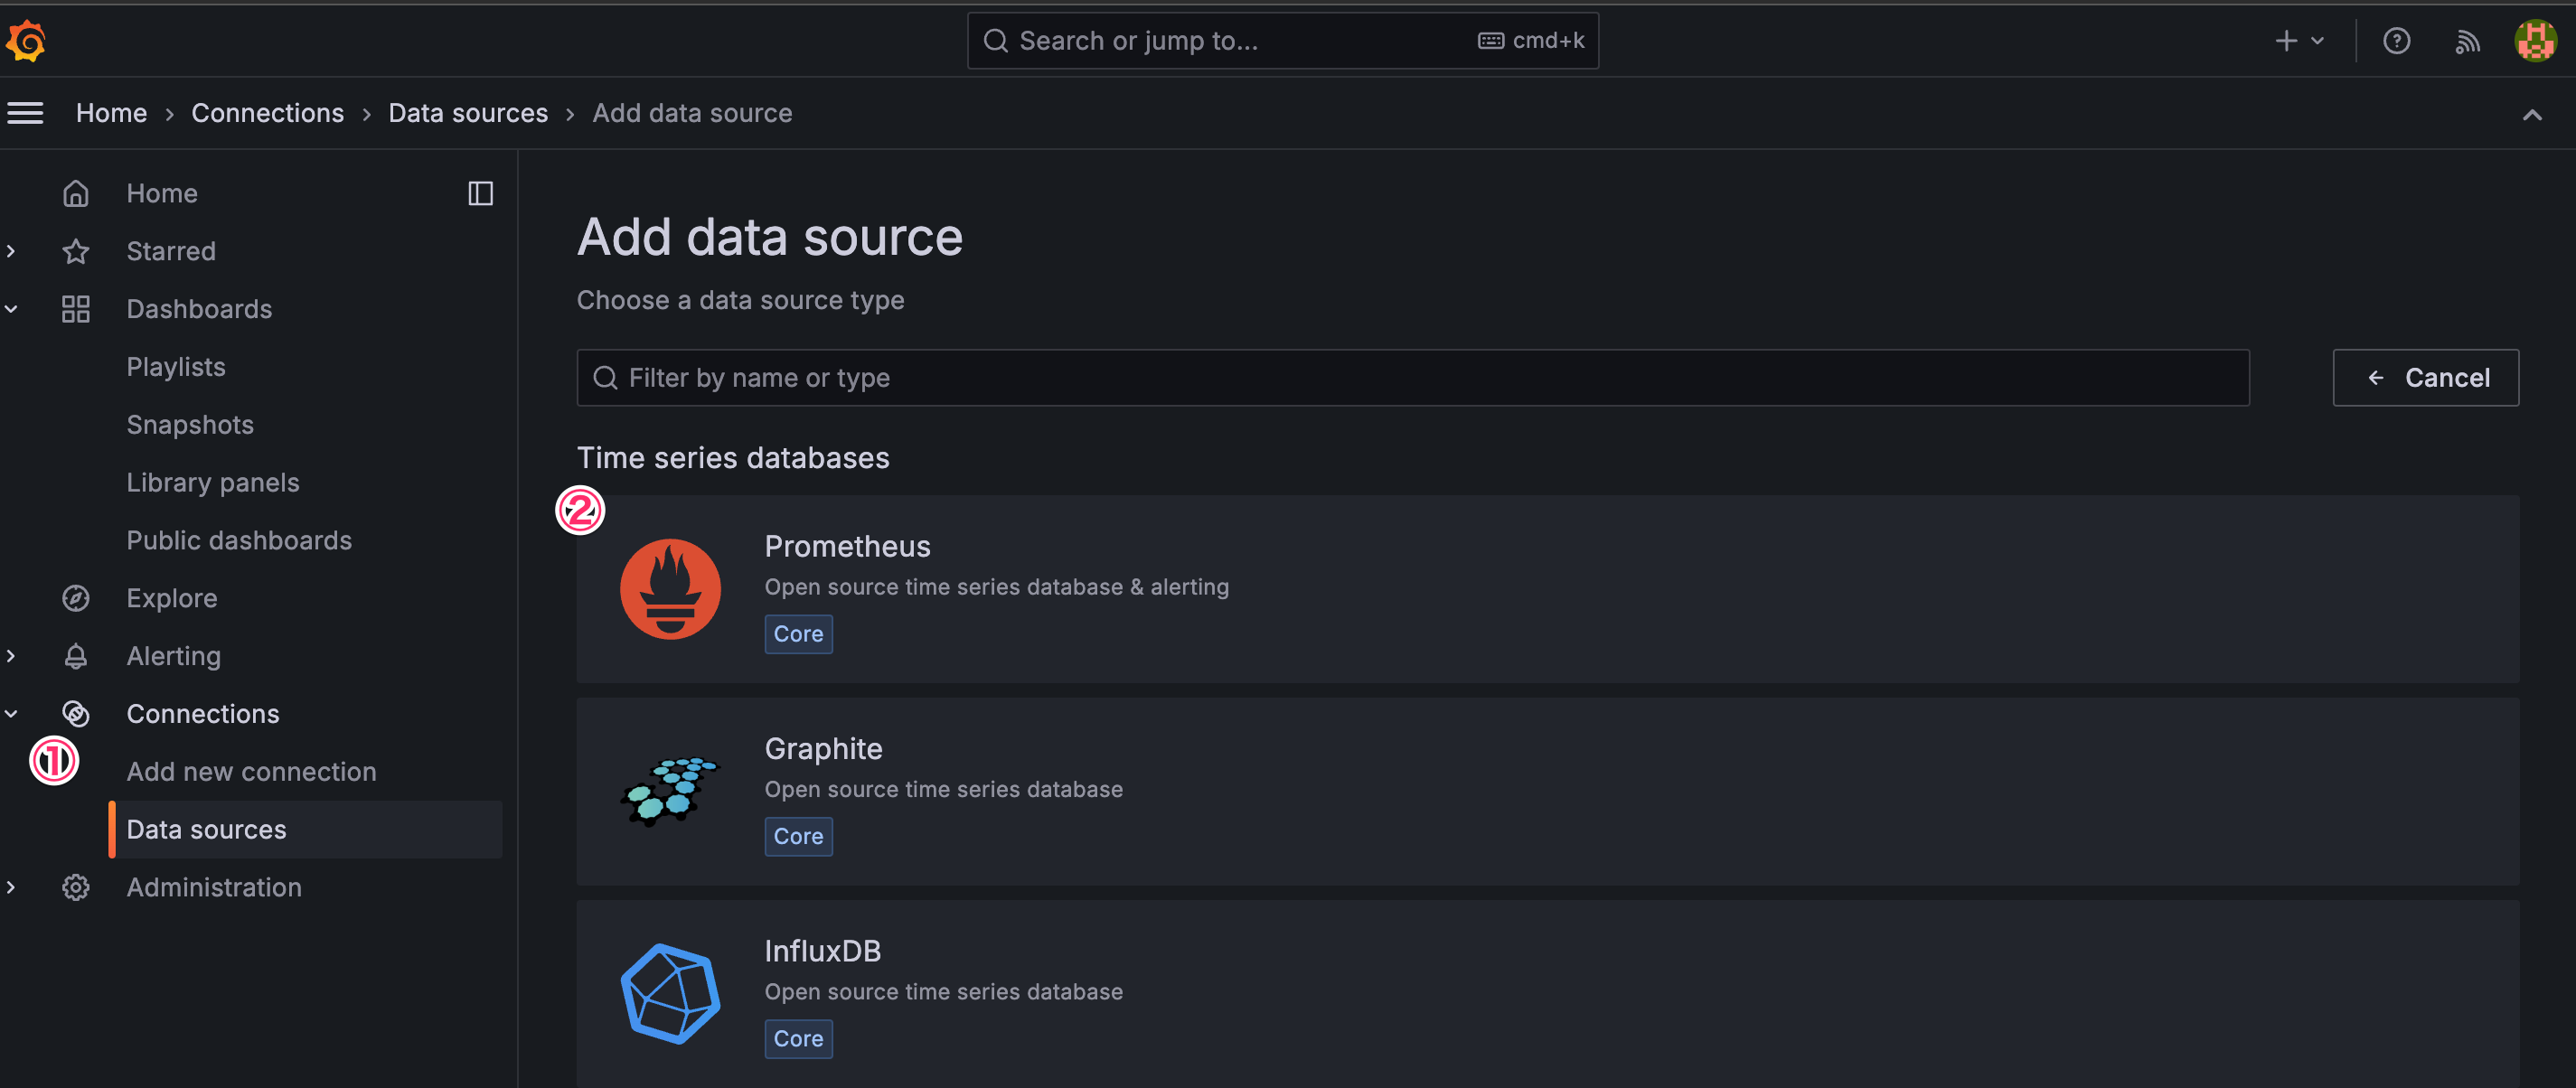
Next, you can connect the Prometheus workspace with the Grafana dashboard by setting workspace as a data source.
Navigate to "Data Sources" in Grafana and select "Prometheus".
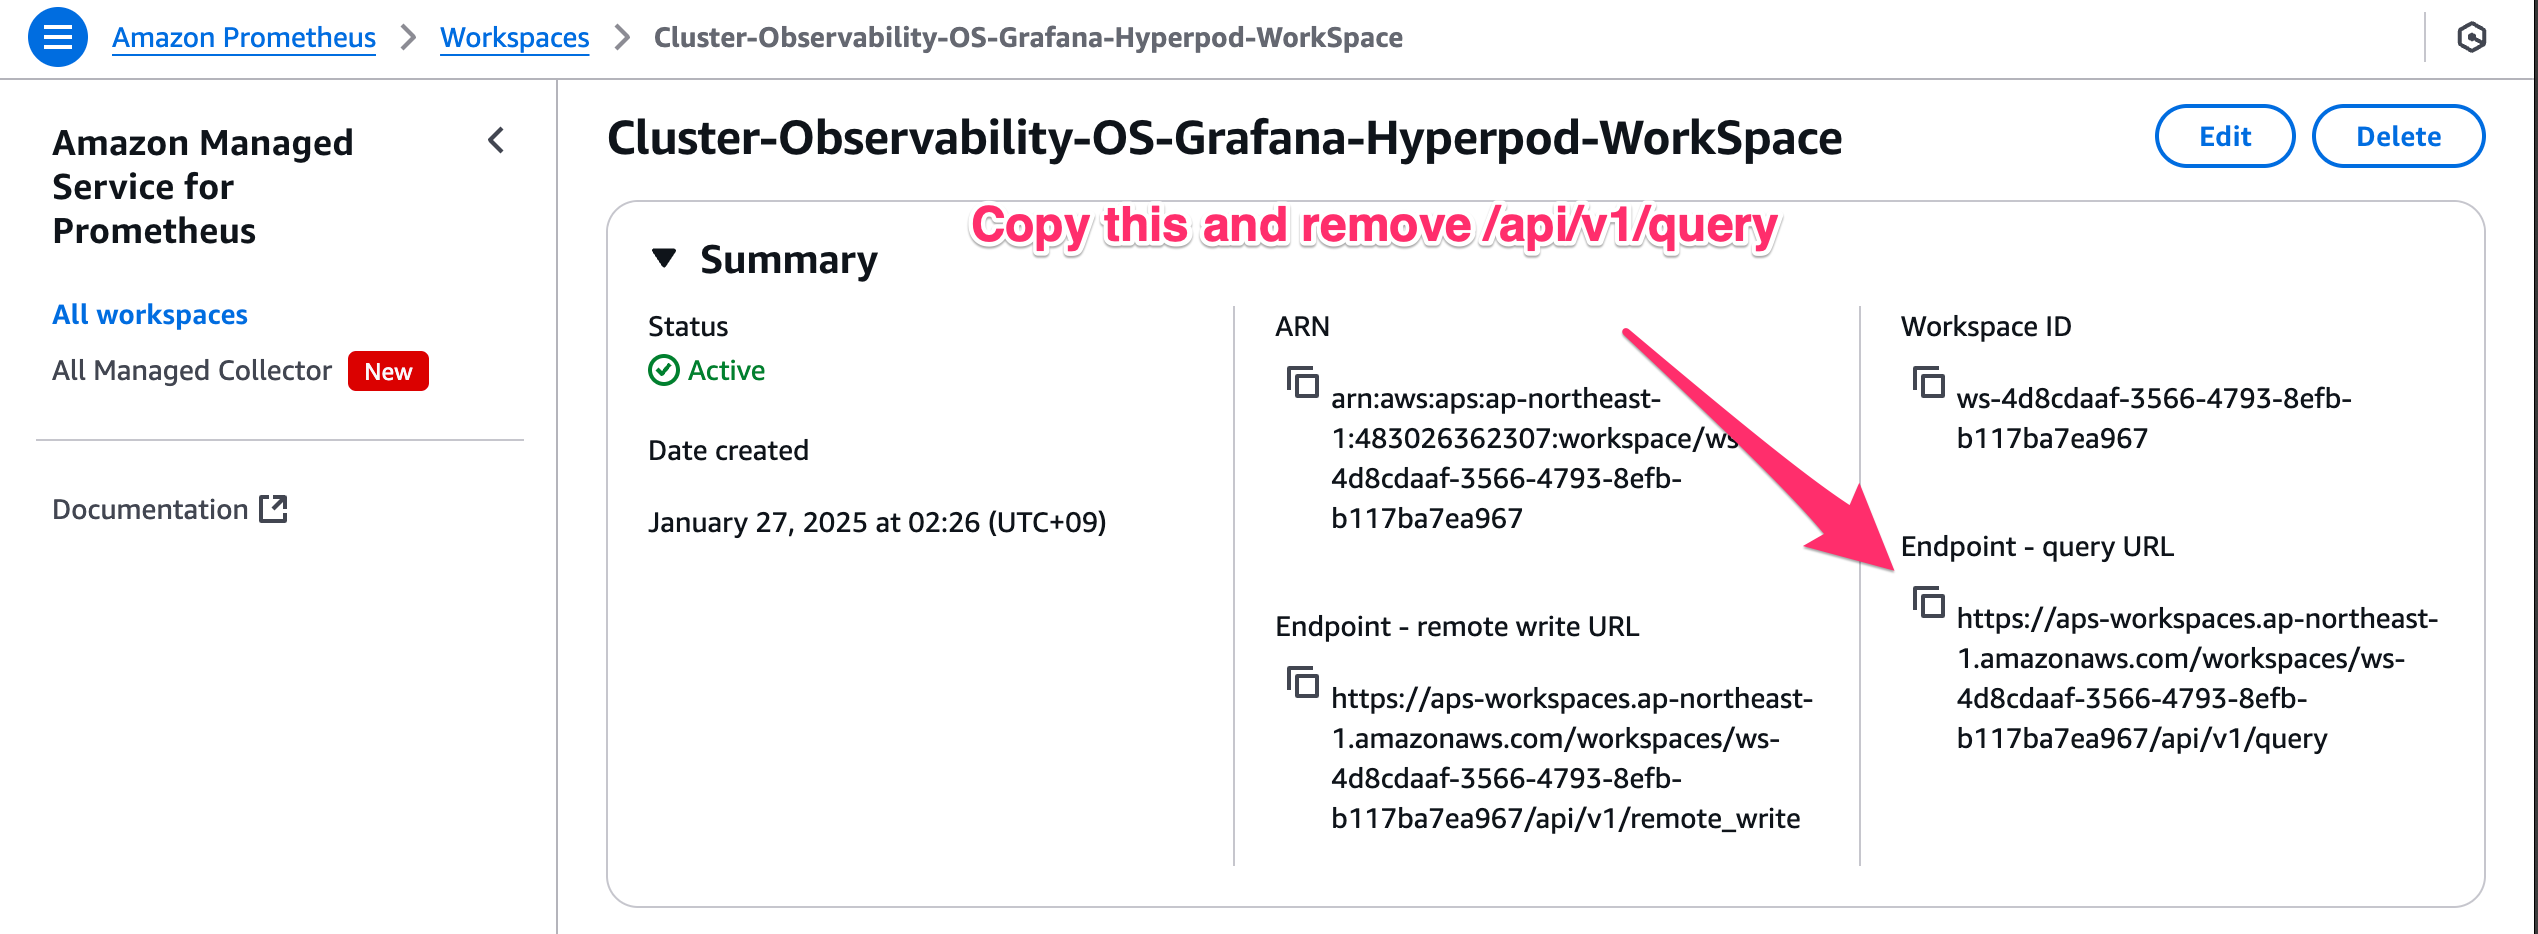
Don't forget to remove the /api/v1/query part of the URL. The correct URL looks like this one:
https://aps-workspaces.us-west-2.amazonaws.com/workspaces/ws-123456-1234-1234-1234/
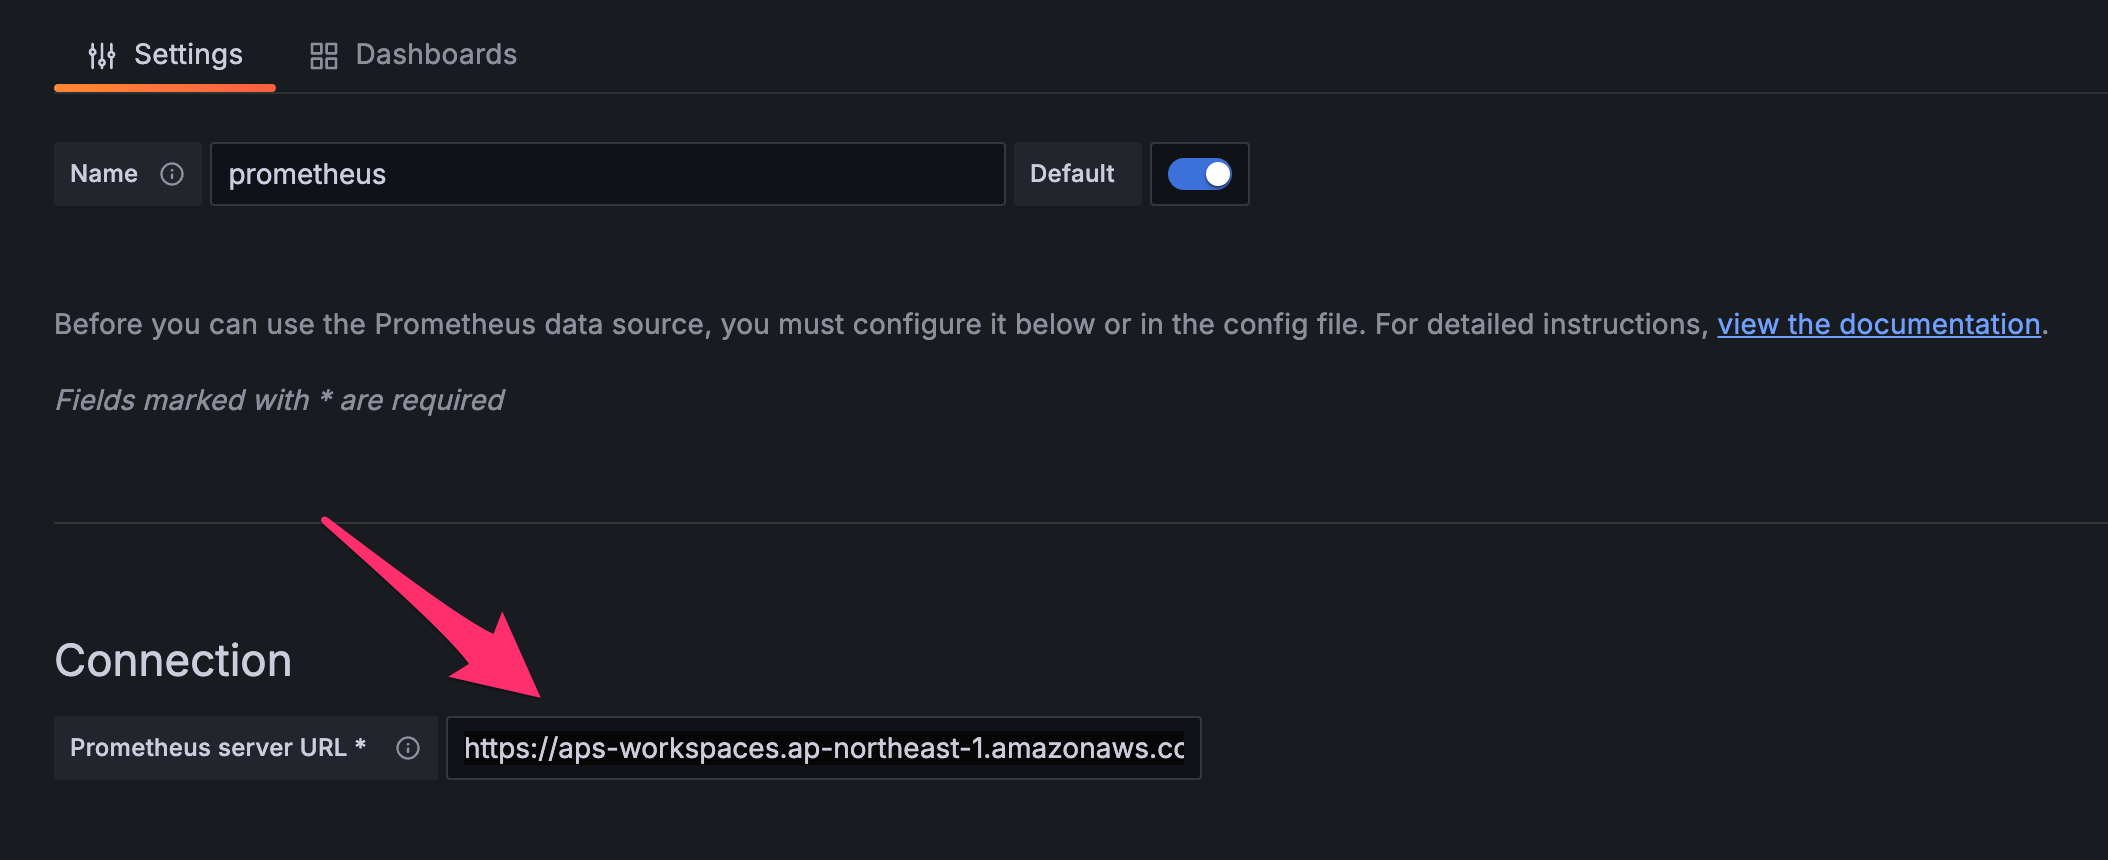
Set the "Prometheus server URL" with the value retrieved from the AWS console.
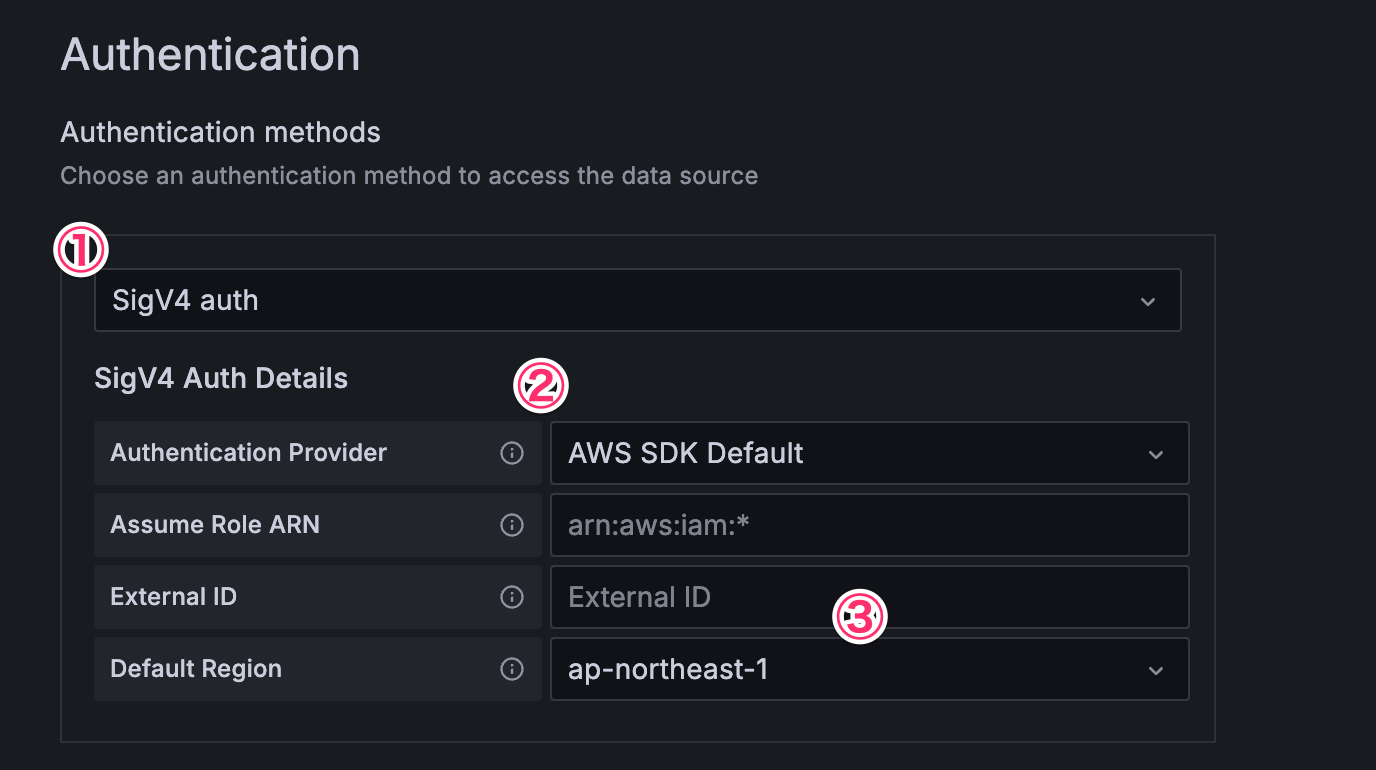
For authentication:
- Choose "
SigV4 auth" - Set "Authentication Provider" as "
AWS SDK Default" - Set "Default Region" to the region where you deployed the CloudFormation stack.
Once the datasource configuration test has passed, you can advance to the next step.
4. Configure Lifecycle Scripts and Install Observability
Follow the same steps as in Method 1 for:
- Adding additional permissions
- Modifying the lifecycle scripts
- Installing Observability in your cluster
5. Build Grafana Dashboards
Finally, with authentication and data sources setup, within your Grafana workspace, select dashboards > new > import.
To display metrics for the exporter services, you can start by configuring and customizing the following open source Grafana Dashboards by copying and pasting the below links:
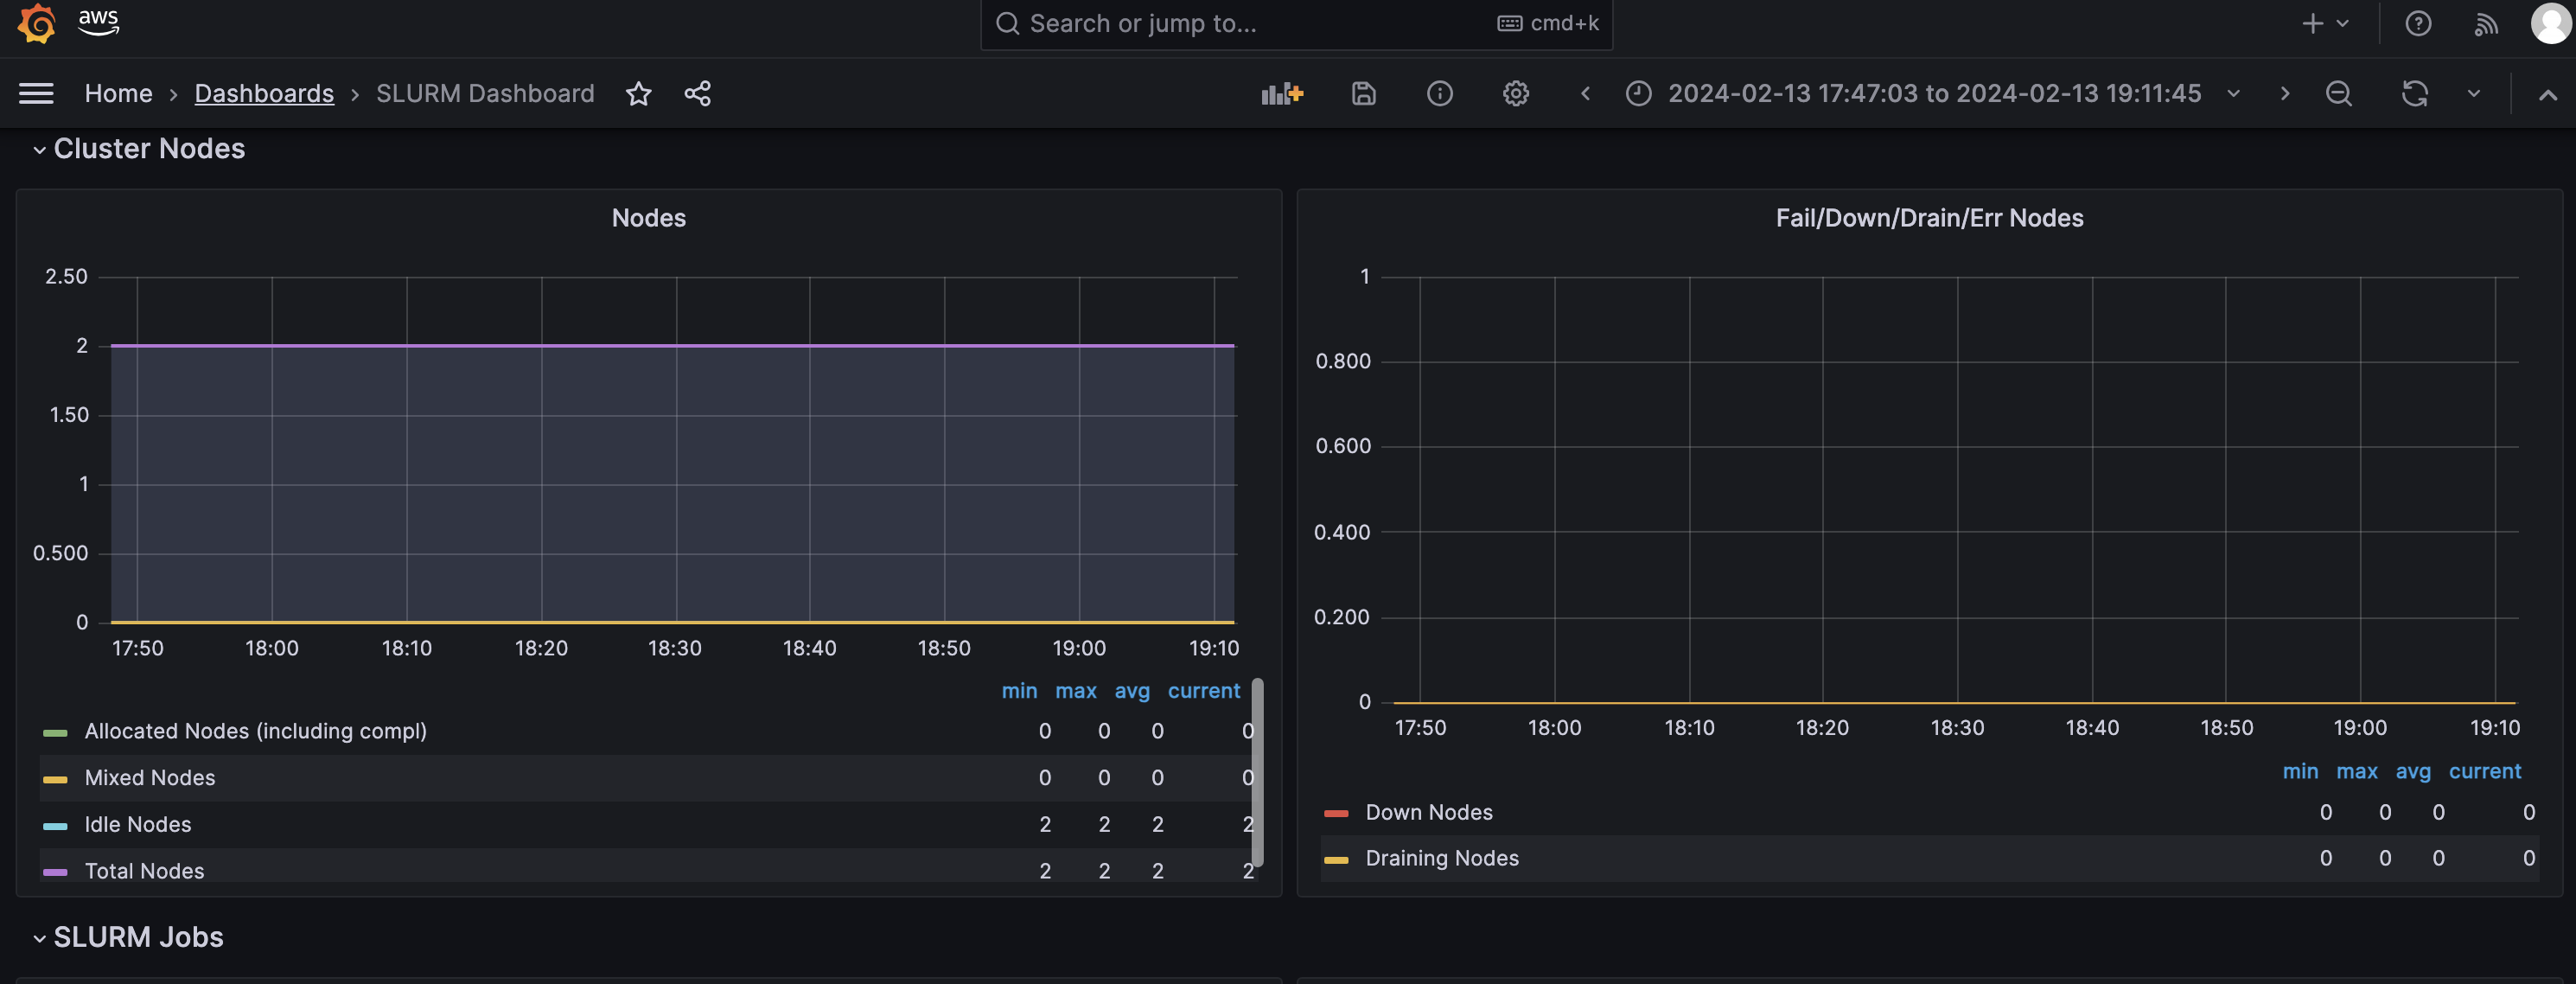
Slurm Exporter Dashboard:
https://grafana.com/grafana/dashboards/4323-slurm-dashboard/
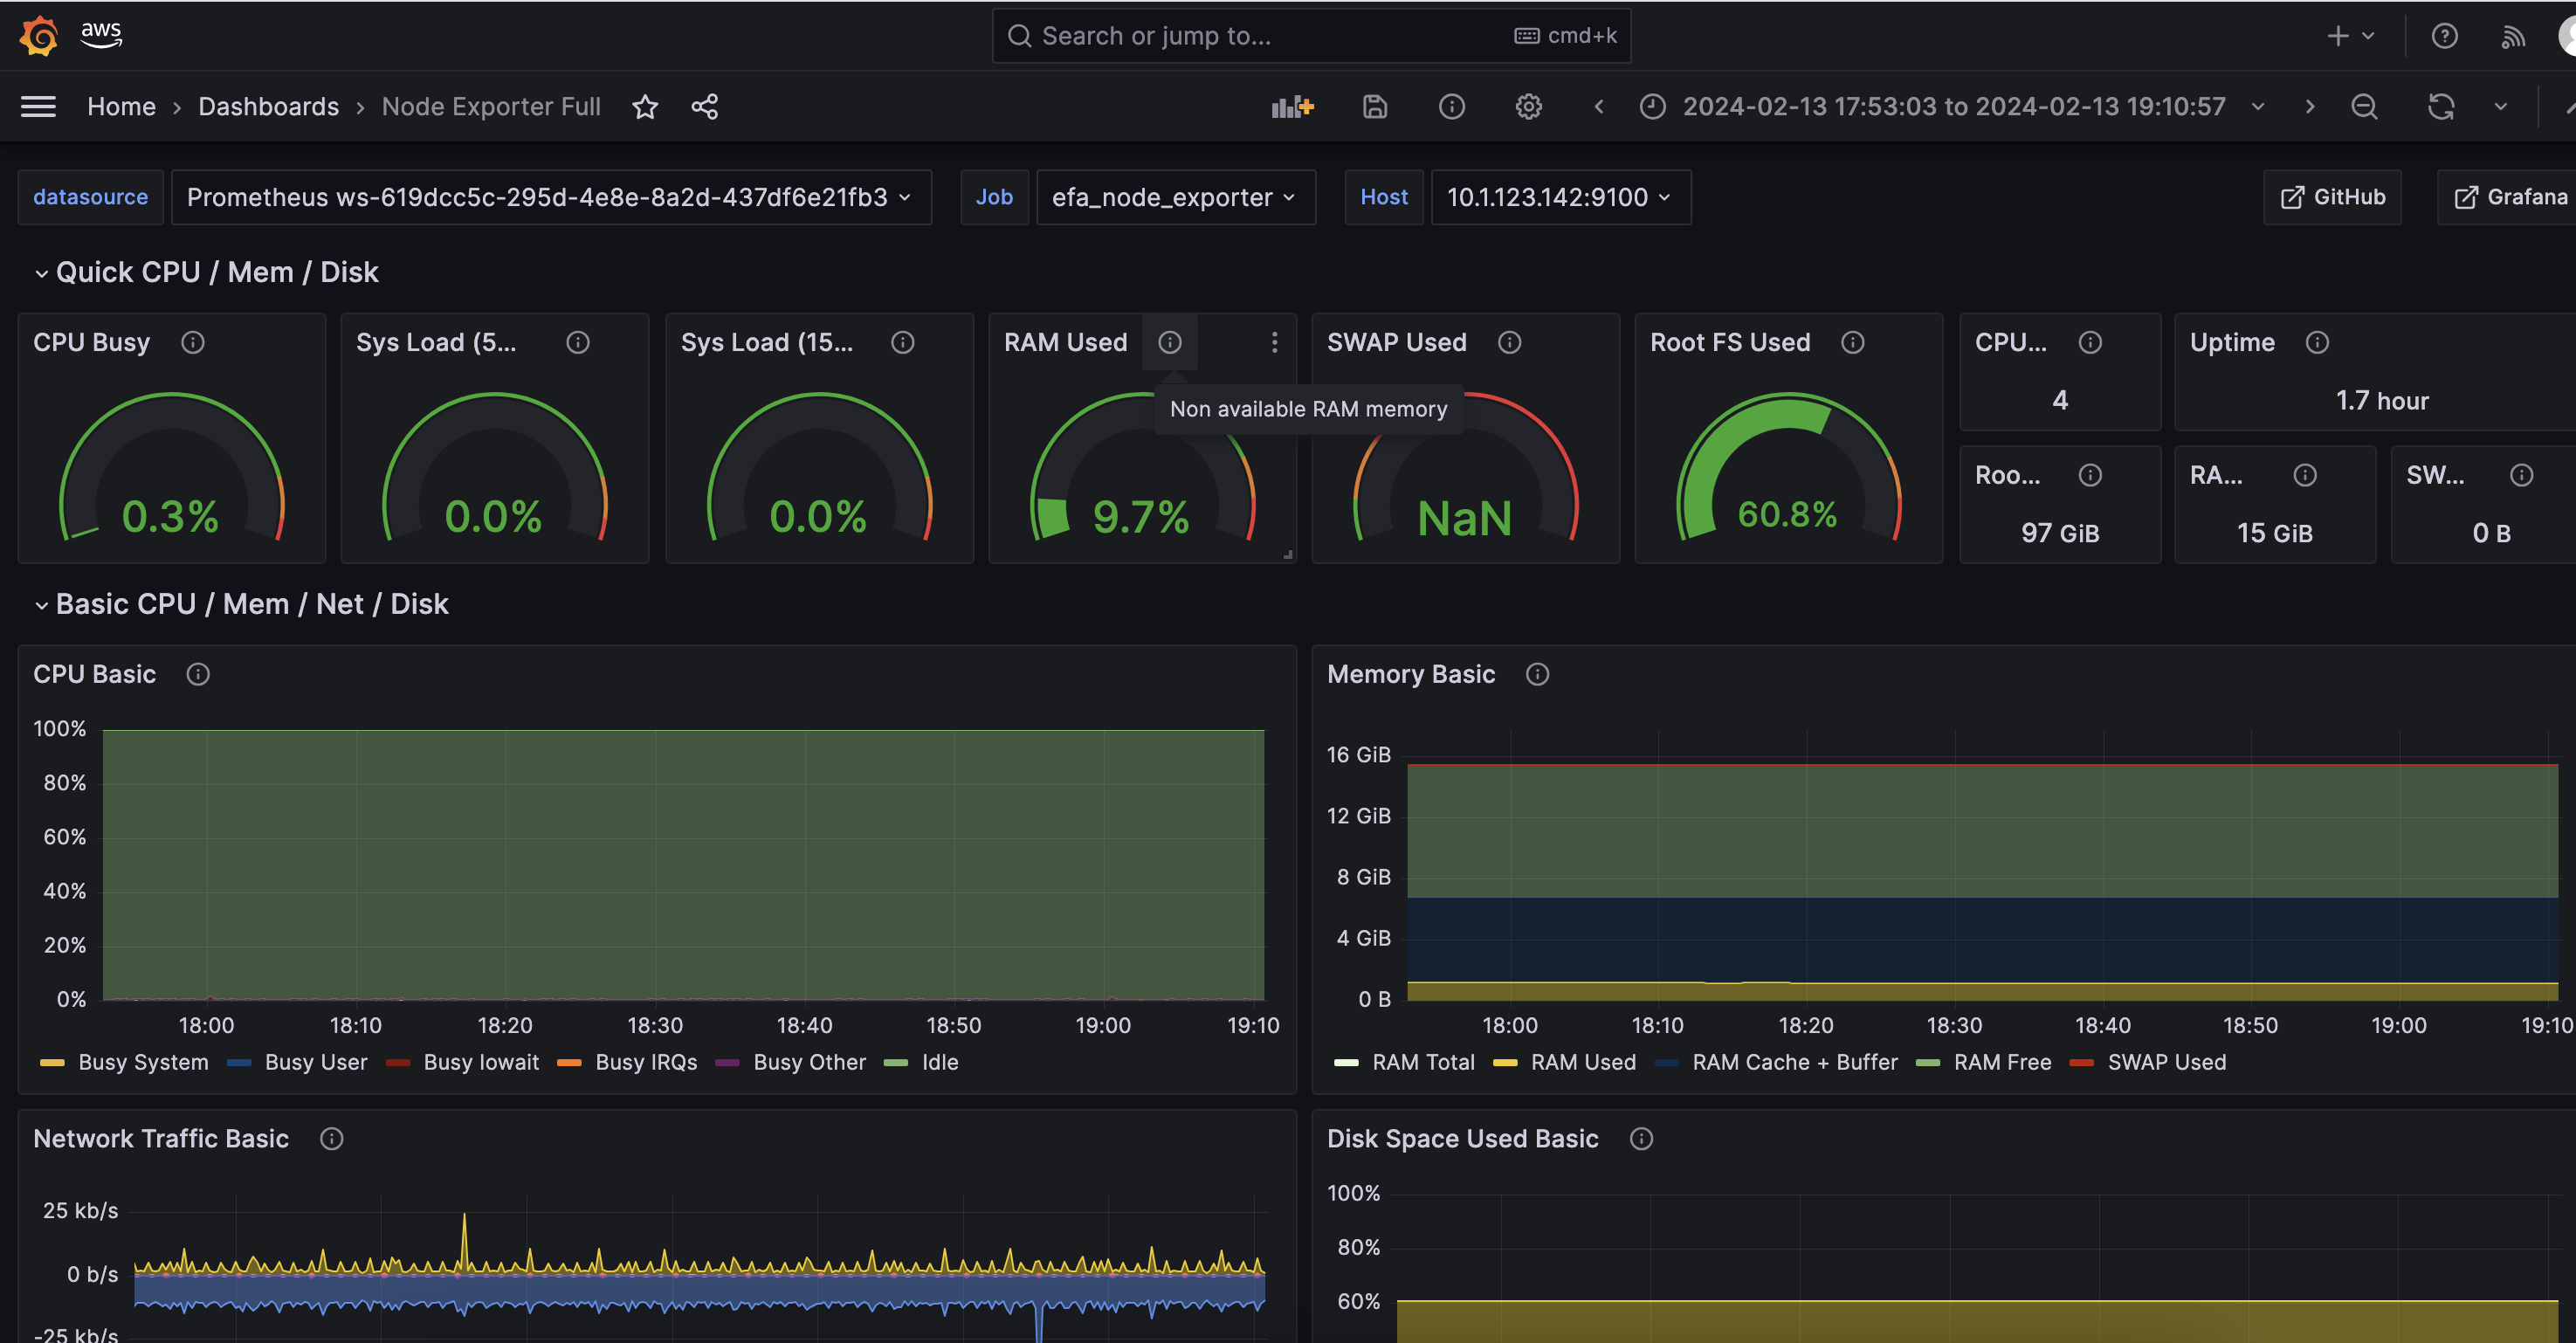
Node Exporter Dashboard:
https://grafana.com/grafana/dashboards/1860-node-exporter-full/
DCGM Exporter Dashboard:
https://grafana.com/grafana/dashboards/12239-nvidia-dcgm-exporter-dashboard/
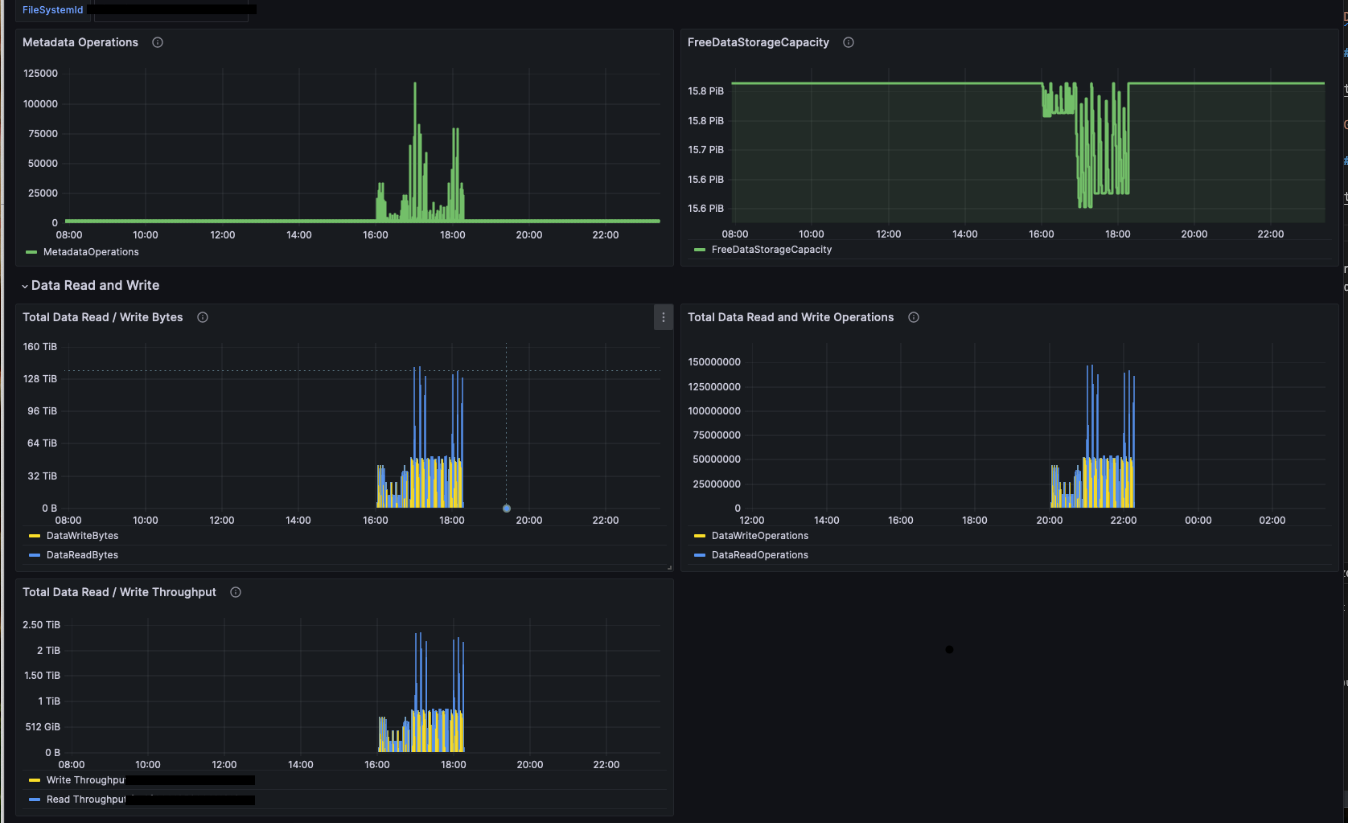
FSx for Lustre Dashboard:
For the Amazon FSx for Lustre dashboard you need to create an additional data source for the Amazon CloudWatch.
https://grafana.com/grafana/dashboards/20906-fsx/
Congratulations, you can now view real time metrics about your SageMaker HyperPod Cluster and compute nodes in Grafana!
Next steps
-
As needed, you can modify the pre-configured dashboards to meet your requirements. See the external Grafana document for more details.
-
For Amazon Managed Grafana users: Amazon Managed Grafana includes access to an updated alerting system that centralizes alerting information in a single, searchable view (in the navigation pane, choose Alerts to create an alert). Alerting is useful when you want to receive timely notifications, such as when GPU utilization drops unexpectedly, when a disk usage of your shared file system exceeds 90%, when multiple instances become unavailable at the same time, and so on. You can create alert rules based on metrics or queries and set up multiple notification channels, such as emails and Slack messages. For instructions on setting up alerts with Slack messages, see the Setting Up Slack Alerts for Amazon Managed Grafana GitHub page.
-
The number of alerts is limited to 100 per Grafana workspace. If you need a more scalable solution, check out the alerting options in Amazon Managed Service for Prometheus.