Viewing investigations & interacting with the agent
Viewing investigations in the DevOps Agent console
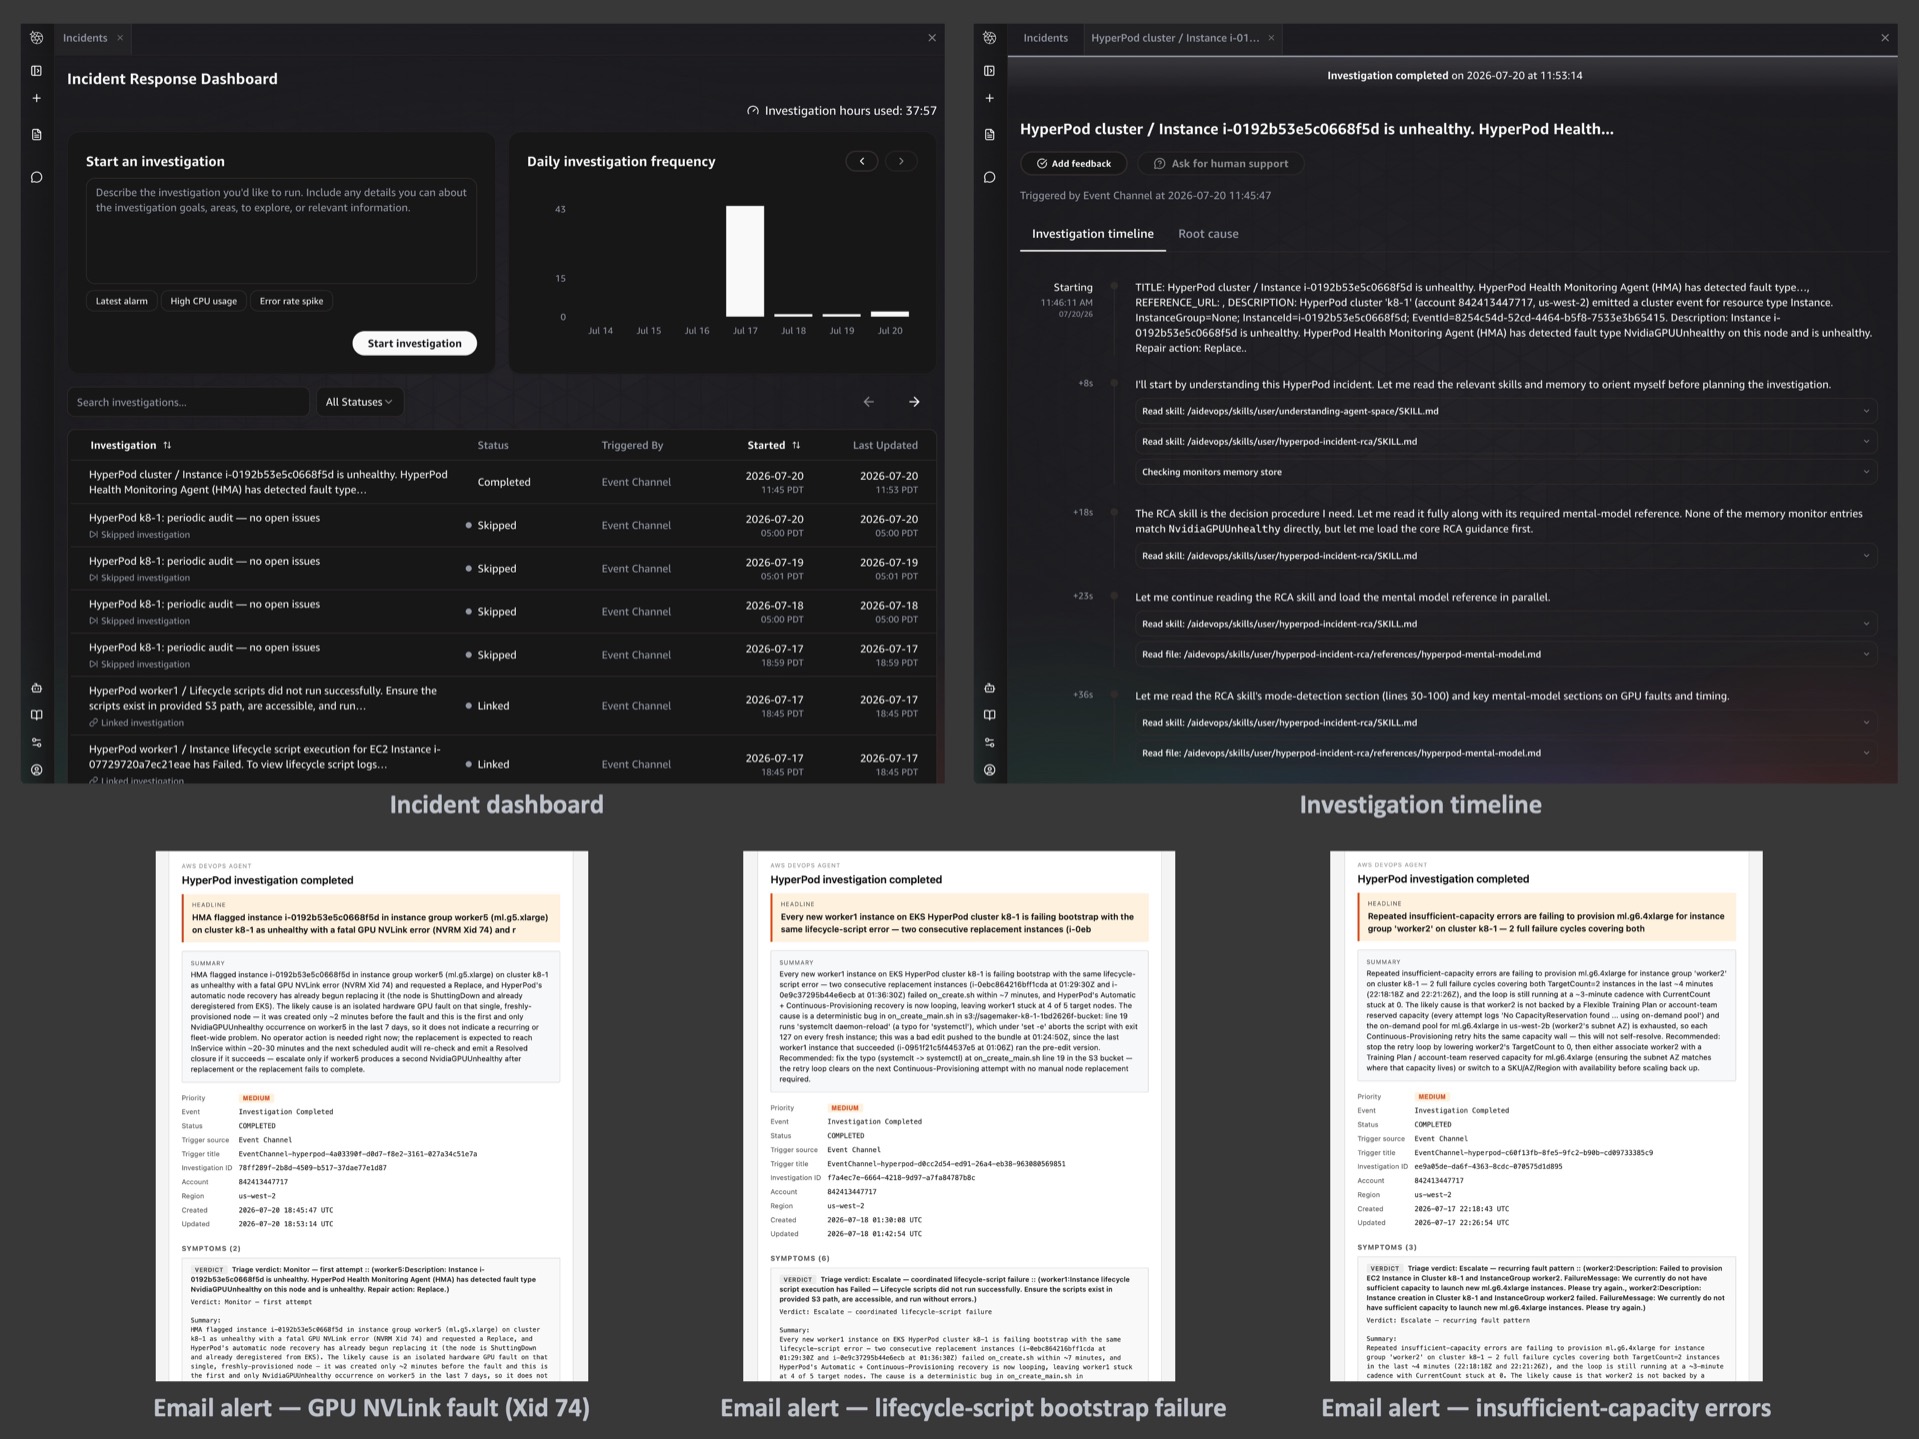
For readers new to AWS DevOps Agent, here's how to navigate to your investigations:
- Open the AWS DevOps Agent console.
- Select your Agent Space (named
hyperpod-<cluster-name>-devops-agentby default). - From the Launch web app drop-down, choose an option to open the DevOps Agent web app.
- Select Incidents from the left navigation pane to open the Incident Response Dashboard. It lists all investigations with their subject, status, and timestamp.
- Select any investigation to see its full timeline, journal records, and the verdict report.
Asking the agent directly - the DevOps Agent chat UI
Beyond the automated emails, you don't have to wait for the next investigation to get answers about your cluster. You can open the DevOps Agent's AI chat at any time and ask follow-up questions in plain English - the agent answers from the live cluster state, the investigation history, and the skills it has been taught.
For example:
- "I got an email about a GPU failure in my cluster. Did it get resolved now with HyperPod's resiliency?" - the agent checks the current cluster state, confirms whether the replacement succeeded, and provides a timeline of what happened (HMA detection → replacement initiated → node back in service), along with anything to watch for.
- "Are there unhealthy Pods on my cluster?" - the agent inspects the
Kubernetes state and reports any
CrashLoopBackOffpods orNotReadynodes. - "I just triggered scaling up. Check if it is progressing well." - the agent looks at the cluster's current node counts vs. target counts and reports whether provisioning is on track.
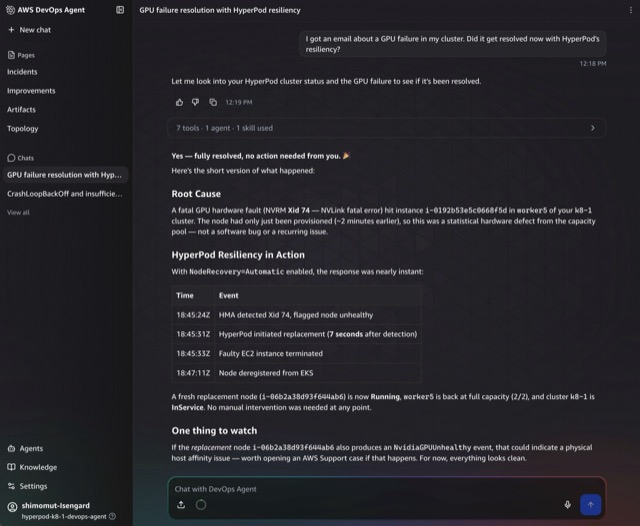
The chat conversations are stored per Agent Space, so you can revisit past interactions alongside the automated investigations. This makes the Agent Space a single pane of glass for both automated incident response and ad-hoc troubleshooting of your HyperPod cluster.
Investigation feedback
After each investigation completes, a Feedback button appears in the DevOps Agent console. Clicking it opens the Investigation feedback dialog, where you can:
- Rate whether the root cause was correct
- Indicate whether human steering was needed during the investigation
- Provide written feedback explaining what could be improved
This structured feedback is stored per investigation. An auto-learning mechanism that uses this feedback to improve future investigations is actively being developed.
Cost at a glance
This solution is designed to be near-zero cost on a healthy cluster and scales proportionally with fault volume, not node count directly.
- Healthy cluster (no faults): only the daily heartbeat fires - approximately $30–60/month in DevOps Agent time.
- Moderate faults (~5/week): approximately $80–120/month; each investigation is ~$4 at an 8-minute average.
- Supporting AWS infrastructure (Lambda, S3, Secrets Manager, EventBridge, SES, CloudWatch Logs): under $2/month.
- Free tier: new DevOps Agent customers receive a 2-month free trial (20 hours of investigations + 20 hours of chat per month).
At scale, the triage skill is your cost saver - a single hardware fault can generate 5–10 correlated EventBridge events, and triage links them into a single investigation instead of five.
For detailed cost tables by cluster size, scaling analysis, and cost control levers, see the AWS blog post (link to be added when published).