Debug why your jobs are not starting
Jobs in dynamic queue
First of all, unless you submit a job on the "alwayson" queue, it will usually take between 5 to 10 minutes before your job can start as Engineering Development Hub needs to provision your capacity. This can vary based on the type and number of EC2 instances you have requested for your job. We recommend to provision EDH Optimized AMIs to reduce this cold time.
Verify Queue log
If your job is not starting, first verify the queue log under /opt/edh/<EDH_CLUSTER_ID>/cluster_manager/orchestrator/<SCHEDULER_ID>/queues/<queue_name>.log
tree /opt/soca/edh-demo/cluster_manager/orchestrator/logs/openpbs-default/queues/
/opt/soca/edh-demo/cluster_manager/orchestrator/logs/openpbs-default/queues/
├── high.log
├── high.log.2026-03-24
├── high.log.2026-03-31
├── job-shared.log
├── job-shared.log.2026-03-24
├── job-shared.log.2026-03-31
├── low.log
├── low.log.2026-03-24
├── low.log.2026-03-31
├── normal.log
├── normal.log.2026-03-24
├── normal.log.2026-03-31
├── test.log
├── test.log.2026-03-24
└── test.log.2026-03-31
If the log is not created or you don't see any update on it even though you submitted a job, try to run the dispatcher.py command manually. On the scheduler, list all crontabs as root crontab - and refer to "Automatic Host Provisioning" section:
# Automatic Host Provisioning
* * * * * /opt/edh/edh-demo/cluster_manager/orchestrator/jobs_dispatcher.sh compute
* * * * * /opt/edh/edh-demo/cluster_manager/orchestrator/jobs_dispatcher.sh job-shared
* * * * * /opt/edh/edh-demo/cluster_manager/orchestrator/jobs_dispatcher.sh test
Run the command manually and look for any errors. Common errors include malformed yaml files.
Verify Job log
Additionally, you can get per-job detailed logs via /opt/edh/<EDH_CLUSTER_ID>/cluster_manager/orchestrator/<SCHEDULER_ID>/jobs/<job_id>.log
tree /opt/soca/$EDH_CLUSTER_ID/cluster_manager/orchestrator/logs/openpbs-default/jobs/
├── 10.log
├── 11.log
├── 12.log
├── 13.log
├── 14.log
├── 15.log
Verify the job resource
This guide assume you have created your queue correctly
Run qstat -f <job_id> | grep -i resource and try to locate compute_node or stack_id resource. When your job is launched, these resources does not exist. The script dispatcher.py. running as a crontab and executed every 3 minutes will create these resources automatically.
Example of job having all resources configured correctly
# Job with Engineering Development Hub resources
bash-4.2$ qstat -f 2 | grep -i resource
    Resource_List.instance_type = m5.large
    Resource_List.ncpus = 3
    Resource_List.nodect = 3
    Resource_List.nodes = 3
    Resource_List.place = scatter
    Resource_List.select = 3:ncpus=1:compute_node=job2
    Resource_List.stack_id = soca-fpgaami-job-2
Please note these resources are created by dispatcher.py so allow a maximum of 3 minutes between job is submitted and resources are visibles on qstat output
# Job without Engineering Development Hub resources created yet
bash-4.2$ qstat -f 2 | grep -i resource
    Resource_List.instance_type = m5.large
    Resource_List.ncpus = 3
    Resource_List.nodect = 3
    Resource_List.nodes = 3
    Resource_List.place = scatter
    Resource_List.select = 3:ncpus=1
If you see a compute_node different than tbd as well as stack_id, that means Engineering Development Hub triggered capacity provisioning by creating a new CloudFormation stack.
If you go to your CloudFormation console, you should see a new stack being created using the following naming convention: soca-<cluster_name>-job-<job_id>
Verify Node log
On the controller host, access /apps/edh/<EDH_CLUSTER_ID>/shared/logs/bootstrap/compute_node/. This folder contains the output of all logs for all hosts provisioned by EDH
# Retrieve logs for the most recent (2 weeks) jobs
ls -ltr /apps/edh/<EDH_CLUSTER_ID>/shared/logs/bootstrap/compute_node/ | tail -n 5
drwxr-xr-x. 3 root root 6144 Mar 31 14:26 12
drwxr-xr-x. 3 root root 6144 Apr  1 10:22 13
drwxr-xr-x. 3 root root 6144 Apr  1 13:06 14
drwxr-xr-x. 4 root root 6144 Apr  1 14:59 15
drwxr-xr-x. 4 root root 6144 Apr  1 15:37 16

# Filter for a specific job id. Each nodes provisioned for this job will show up on the directory
ls -ltr /apps/edh/<EDH_CLUSTER_ID>/shared/logs/bootstrap/compute_node/10/**/ | tail -n 5
drw-------. 2 root root 6144 Mar 31 14:20 ip-74-0-167-165
drw-------. 2 root root 6144 Mar 31 14:20 ip-74-0-177-39

# For each hosts, you will be able to retrieve the install logs and do any troubleshooting
ls -ltr /apps/edh/<EDH_CLUSTER_ID>/shared/logs/bootstrap/compute_node/10/**/**
-rw-r--r--. 1 root root     118 Mar 31 14:14 bootstrap_s3_location.log
-rw-r--r--. 1 root root 1818089 Mar 31 14:17 02_setup.log
-rw-r--r--. 1 root root    5779 Mar 31 14:18 03_setup_post_reboot.log
-rw-r--r--. 1 root root  112752 Apr  3 14:10 sync_ad_users.log
If CloudFormation stack is NOT "CREATE_COMPLETE"

Click on the stack name then check the "Events" tab and refer to any "CREATE_FAILED" errors
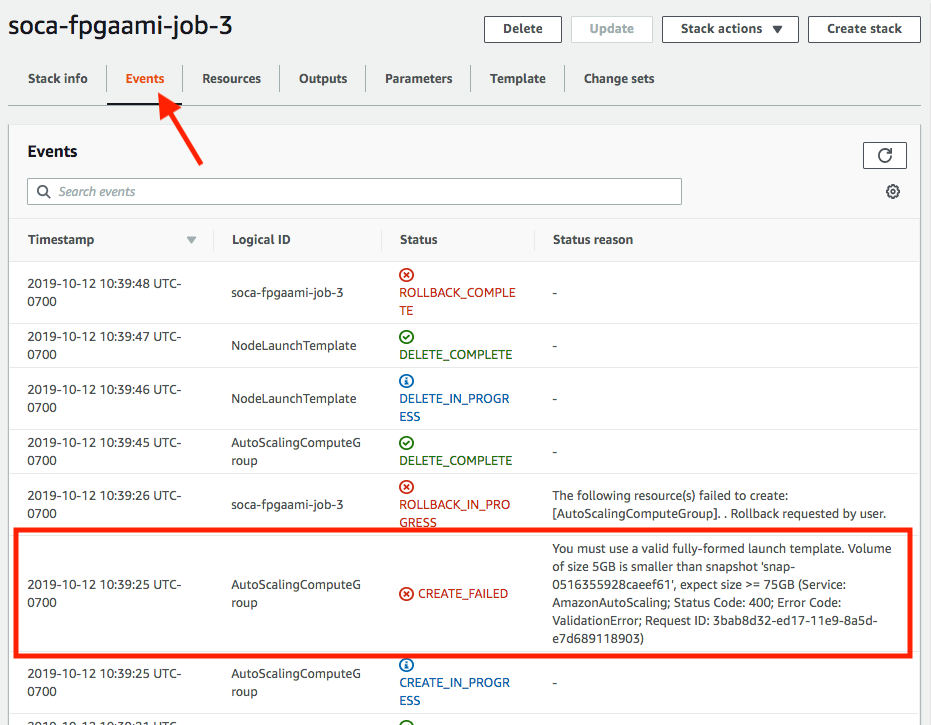
In this example, the size of root device is too small and can be fixed by specify a bigger EBS disk using -l root_size=75
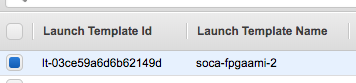
If CloudFormation stack is "CREATE_COMPLETE"

First, make sure CloudFormation has created a new "Launch Template" for your job.
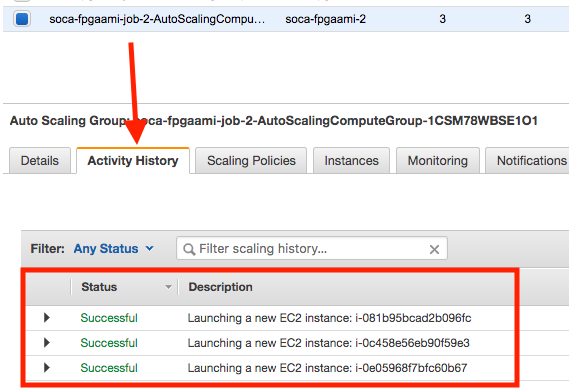
Then navigate to AutoScaling console, select your AutoScaling group and click "Activity". You will see any EC2 errors related in this tab.
Here is an example of capacity being provisioned correctly
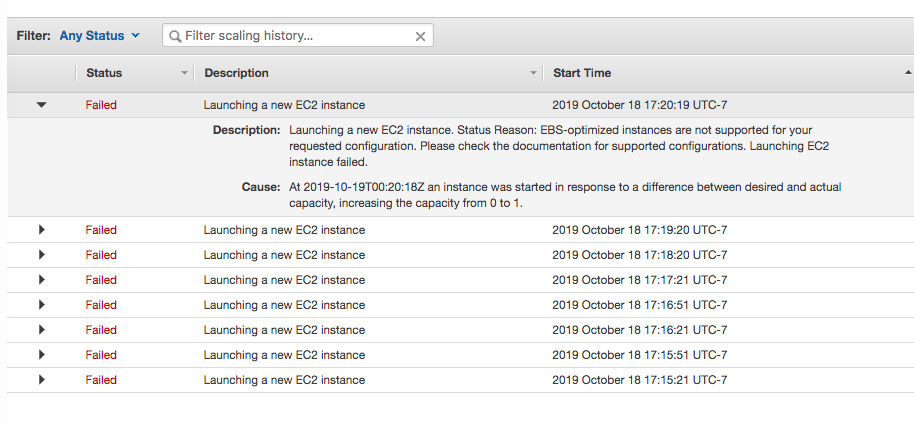
Here is an example of capacity provisioning errors:
If capacity is being provisioned correctly, go back to Engineering Development Hub and run pbsnodes -a. Verify the capacity assigned to your job ID (refer to resources_available.compute_node) is in state = free.
pbsnodes -a
ip-60-0-174-166
     Mom = ip-60-0-174-166.us-west-2.compute.internal
     Port = 15002
     pbs_version = 18.1.4
     ntype = PBS
     state = free
     pcpus = 1
     resources_available.arch = linux
     resources_available.availability_zone = us-west-2c
     resources_available.compute_node = job2
     resources_available.host = ip-60-0-174-166
     resources_available.instance_type = m5.large
     resources_available.mem = 7706180kb
     resources_available.ncpus = 1
     resources_available.subnet_id = subnet-0af93e96ed9c4377d
     resources_available.vnode = ip-60-0-174-166
     resources_assigned.accelerator_memory = 0kb
     resources_assigned.hbmem = 0kb
     resources_assigned.mem = 0kb
     resources_assigned.naccelerators = 0
     resources_assigned.ncpus = 0
     resources_assigned.vmem = 0kb
     queue = normal
     resv_enable = True
     sharing = default_shared
     last_state_change_time = Sat Oct 12 17:37:28 2019
If host is not in state = free after 10 minutes, SSH to the host, sudo as root and check the log file located under /root as well as /var/log/message | grep cloud-init