Monitor Nodes with MetricBeat
What is MetricBeat
Metricbeat is a lightweight shipper that you can install on your servers to periodically collect metrics from the operating system and from services running on the server.
How to enable MetricBeat
MetricBeat is disabled by default. To enable it either submit a job with system_metrics=True or enable this parameter at the queue level. When this feature is active, SOCA will automatically install and configure MetricBeat on all compute nodes provisioned for your jobs. Edit ComputeNodeConfigureMetrics.sh as needed (eg: change the check period, number of process to track etc ...)
Note
The very first job using MetricBeat will take an extra 45 secs as SOCA will perform the initial dashboard setup on Kibana. This is a one time operation, and can be deactivated if you do not want to install MetricBeat dashboards by default
Access MetricBeat data
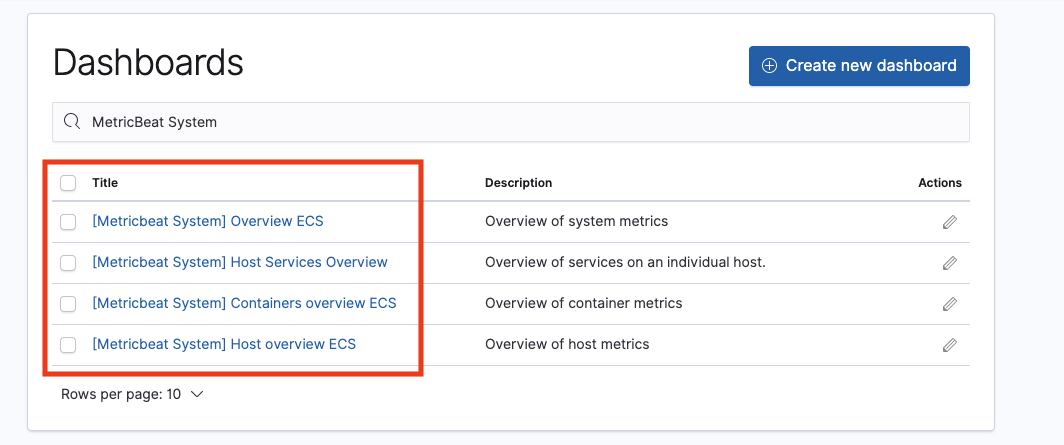
MetricBeat is automatically integrated with your OpenSearch (formerly Elasticsearch) cluster. Click 'Dashboard' and search for "MetricBeat System"
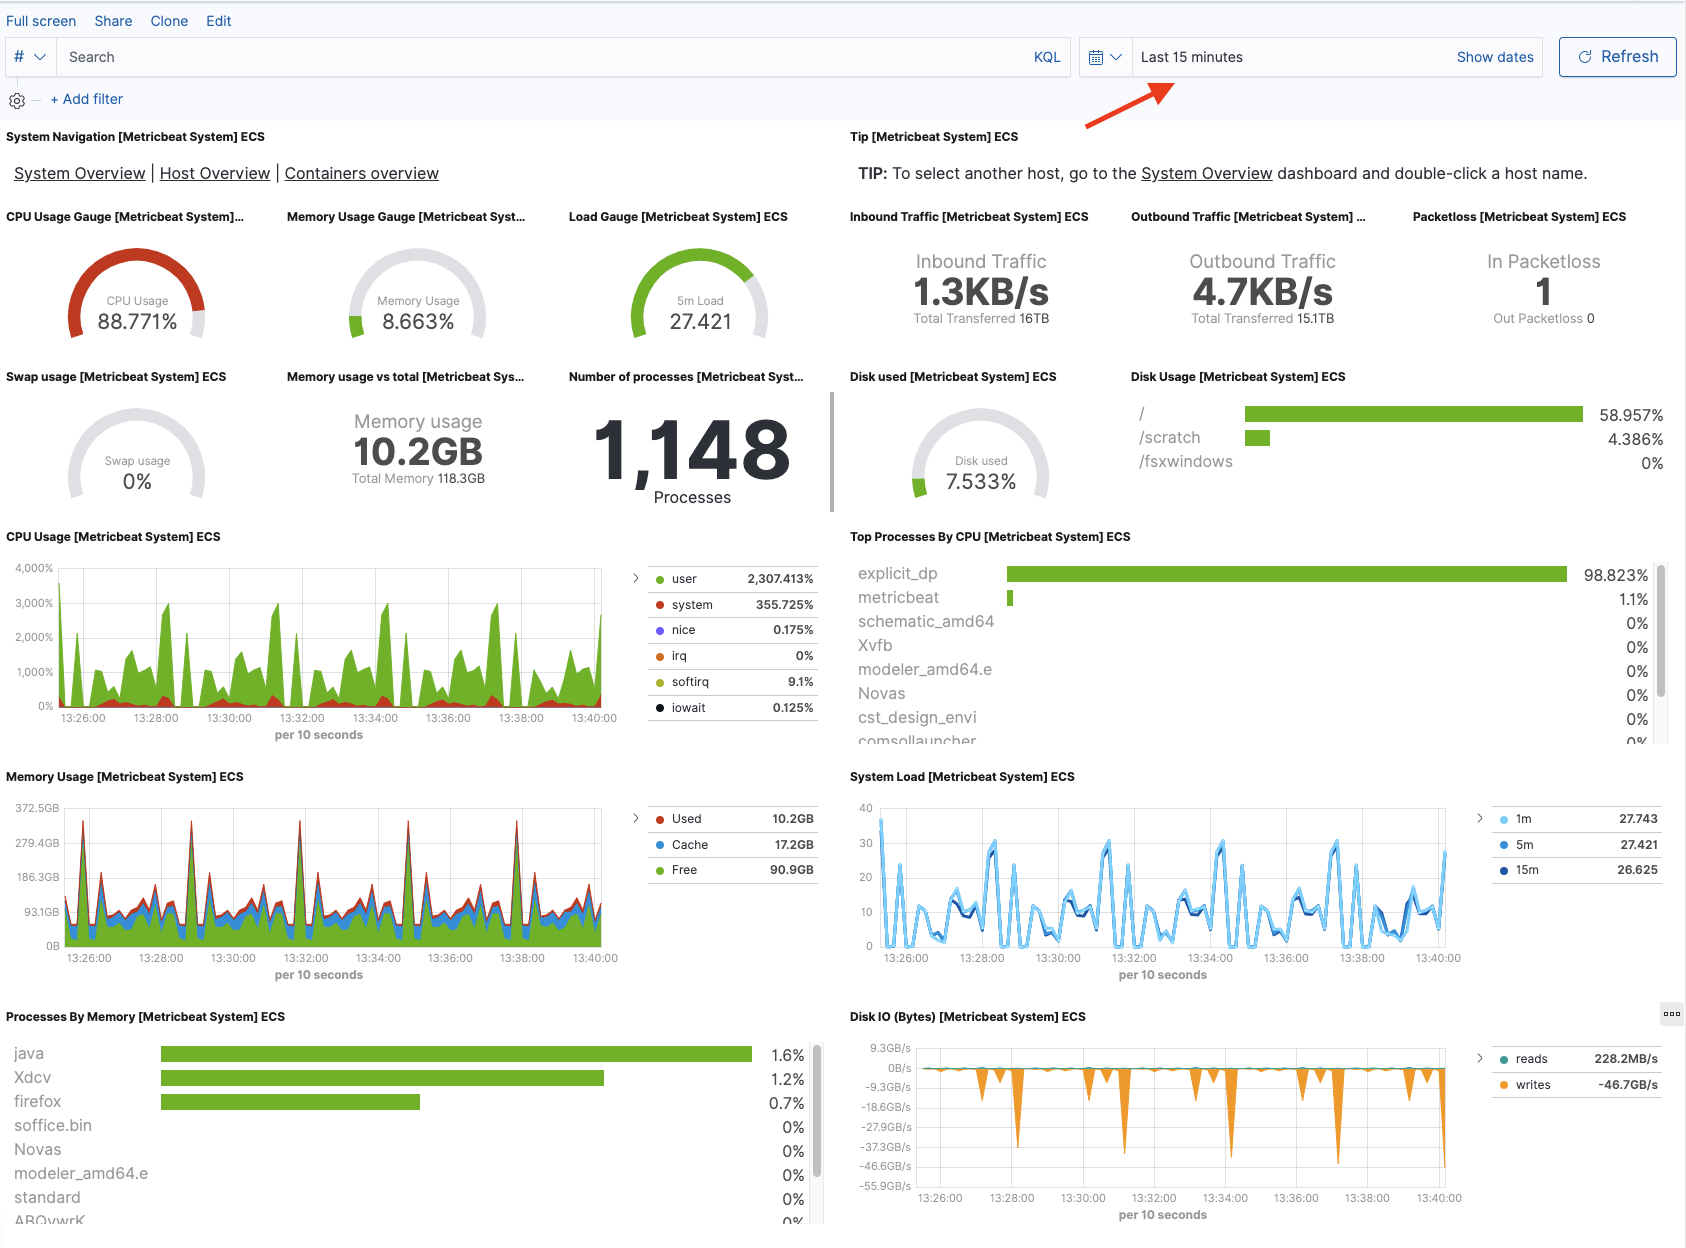
"Host Overview ECS" dashboard will give you system information related to nodes provisioned per job, users or queue. By default ELK reports "Last 15 minutes" data, so make sure you update the time selection accordingly
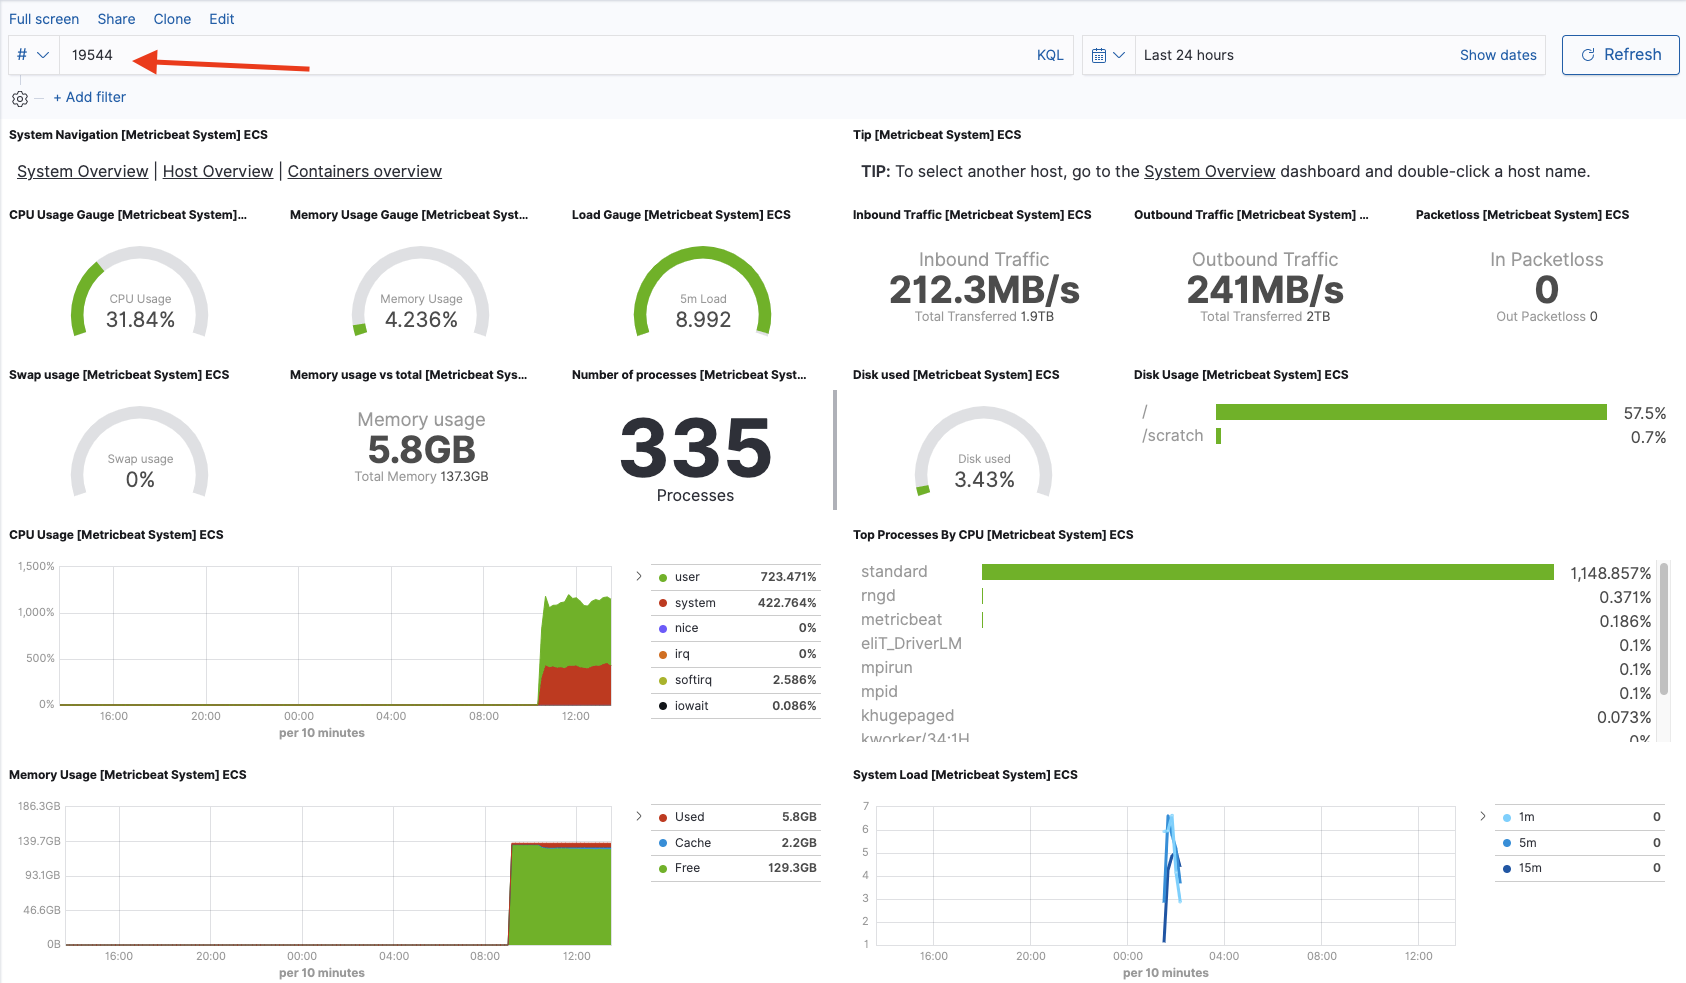
You can filter the results by job id, job owner, queue, process name or host IP. See the example below which return metrics information for job 19544